Where Do Christmas Trees Come From?
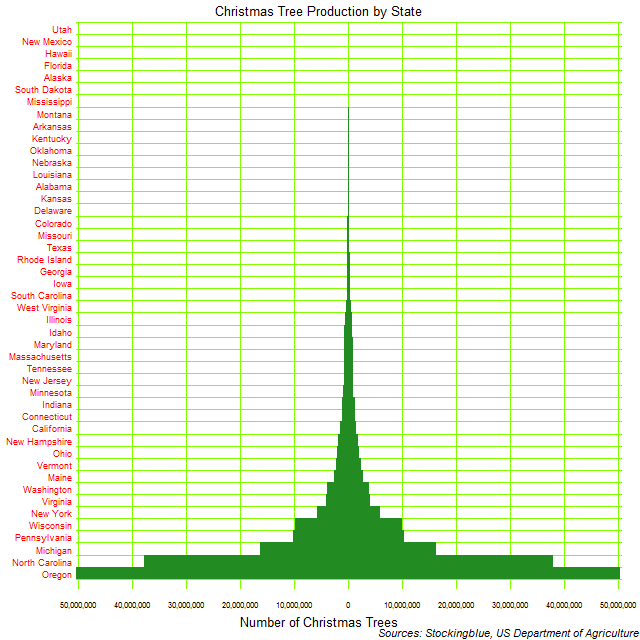
The chart above shows the number of Christmas trees produced by each state. Unfortunately, Christmas tree production is very skewed and thus the chart does not look like a tree. Oh well, it's the thought that counts. But still, get it together states that are not Oregon or North Carolina.
The Largest Metropolitan Economies in the EU and the US
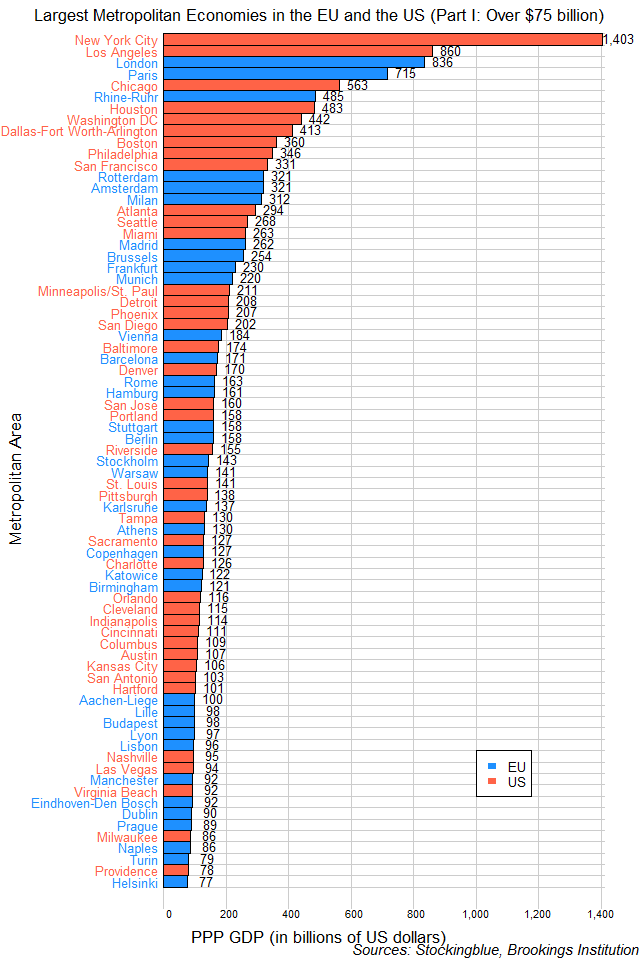
The chart above shows the largest metropolitan economies in the EU and the US that happen to also be among the world's largest 300 metropolitan economies based on the Brookings Institution and have a GDP of over $75 billion. Below, the chart with the cities in the EU and the US among the world's 300 largest with a GDP of $75 billion or less.
The Largest Metropolitan Economies in the US
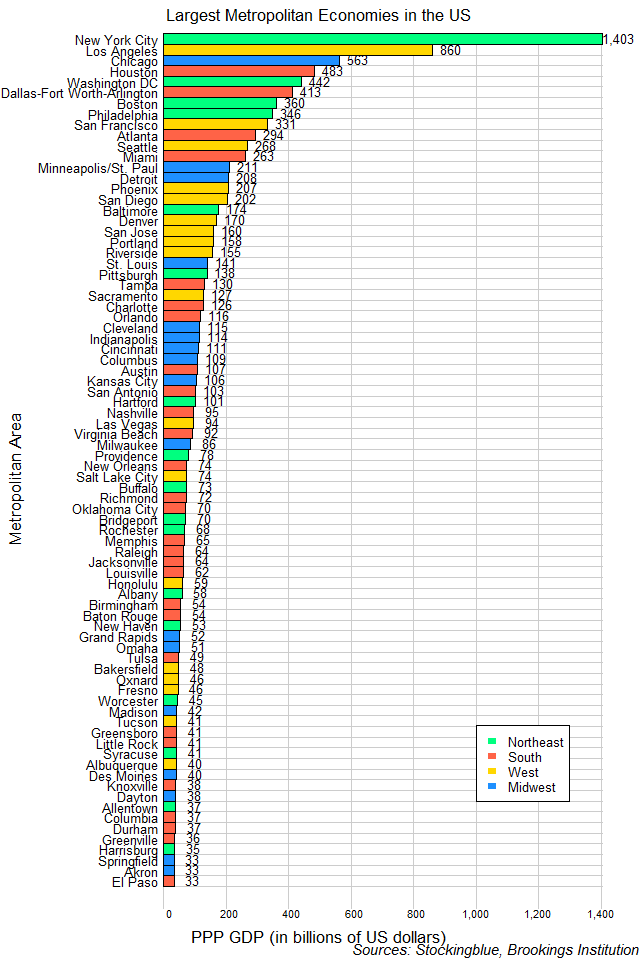
The chart above shows the largest metropolitan economies in the United States that happen to also be among the world's largest 300 metropolitan economies based on the Brookings Institution. Each region of the US has a city in the top four.
The Largest Metropolitan Economies in the EU
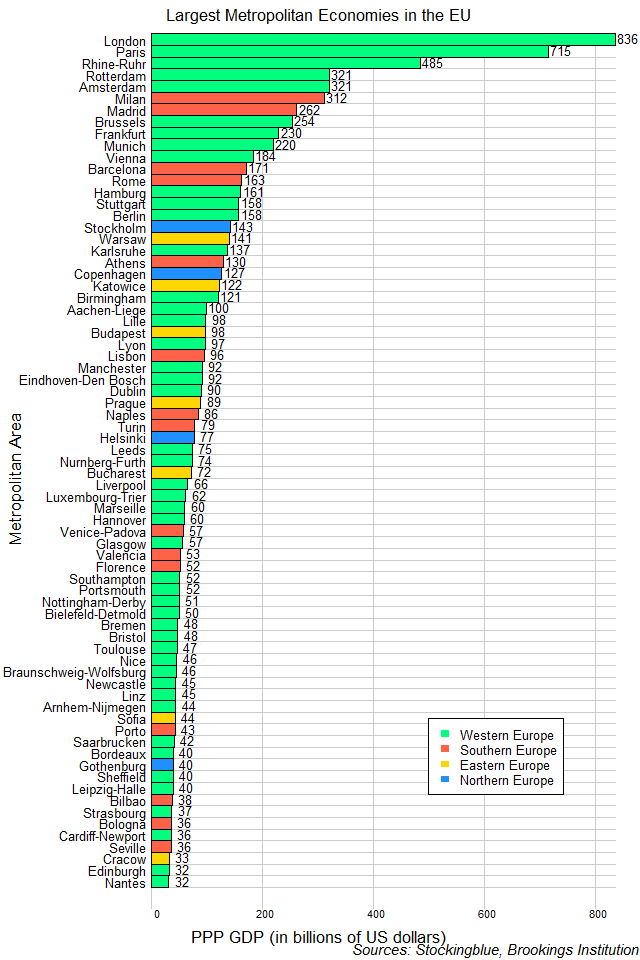
The chart above shows the largest metropolitan economies in the European Union that happen to also be among the world's largest 300 metropolitan economies based on the Brookings Institution. Western Europe dominates in both the number of large economies and the size of each.
Registered Voter Turnout in the 2017 Alabama Senatorial Election
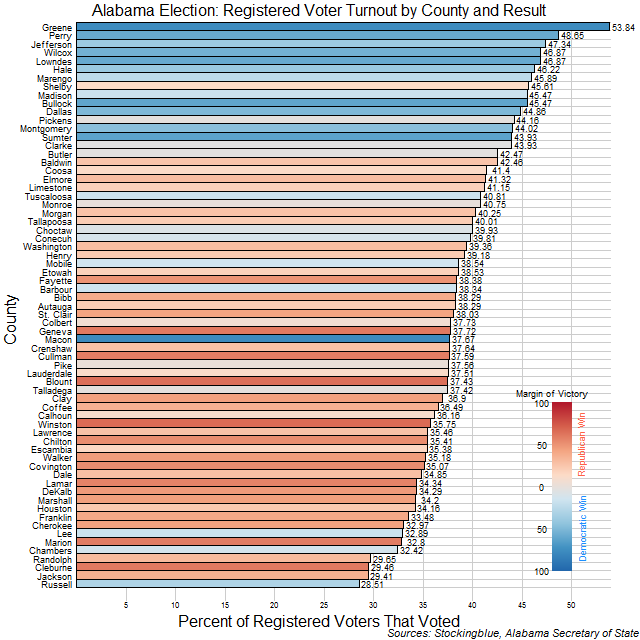
The chart above shows the percentage of registered voters that voted in each county and the party that won said county. The Democrats won the counties where a greater percentage of registered voters showed up to vote. The only decisive victory the Democrats had where registered voters did not really show up to the polls was in Macon County. The Republicans only won one county (Shelby) where registered voters actually showed up in great numbers.
Voter Registration in the 2017 Alabama Senatorial Election
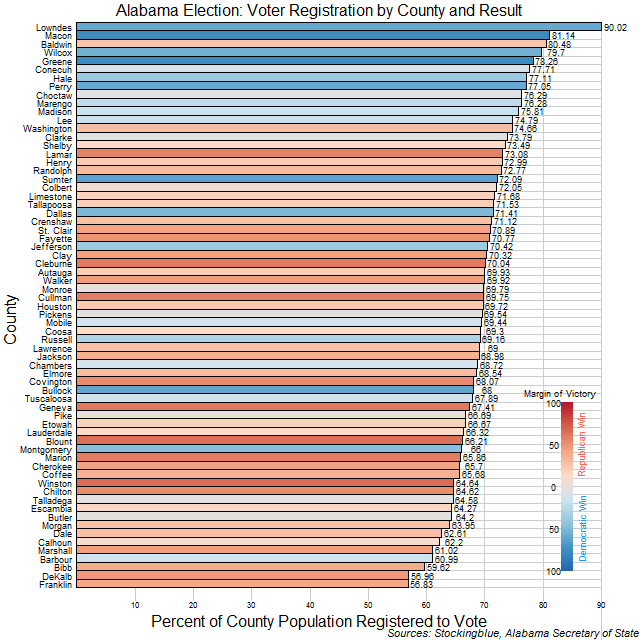
The chart above shows the percentage of people that are registered to vote in each county and the party that won each county. The Democrats won the counties where a greater percentage of the population is registered to vote. There are some anomalies in the data as Lowndes County has 90 percent of its population registered to vote but 30 percent of its population is under the age of 18 according to the US Census. Several other counties also had more registered voters than voters eligible to vote.
Voter Turnout in the 2017 Alabama Senatorial Election
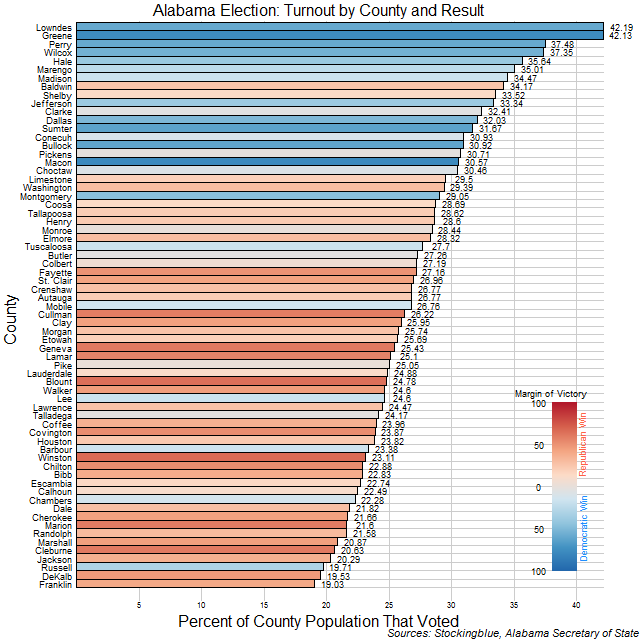
The chart above shows the percentage of people that voted in each county and the party that won each county. The Democrats won the counties where people went to the polls in droves while the Republicans won the counties where most people stayed home.
Cartogram of the 2017 Alabama Special Senatorial Race
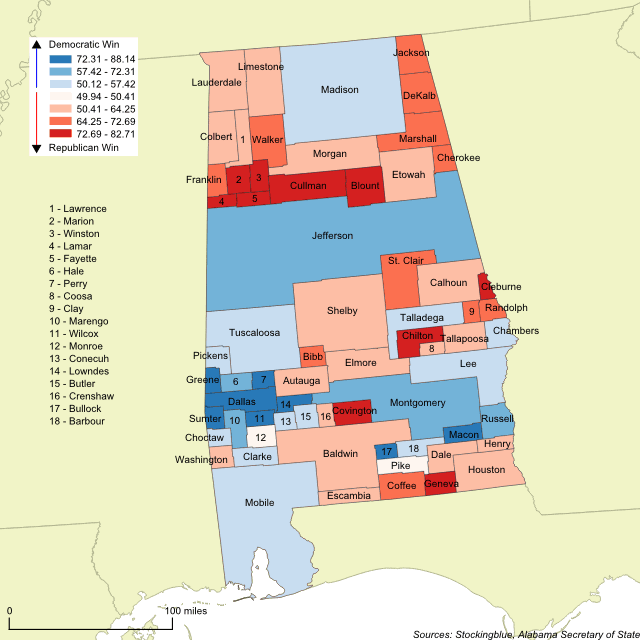
The geographically accurate cartogram above resizes the counties based on the number of votes cast in the Senate race between Republican Roy Moore and Democrat Doug Jones. The more votes cast in a county, the larger it is on the map. This cartogram shows that Jones won the four largest counties (Jefferson, Madison, Mobile, and Montgomery) whereas Moore won the fifth and sixth largest counties. It proved not to be enough to get him past the post.
Proportion of Most Populous Cities in US States
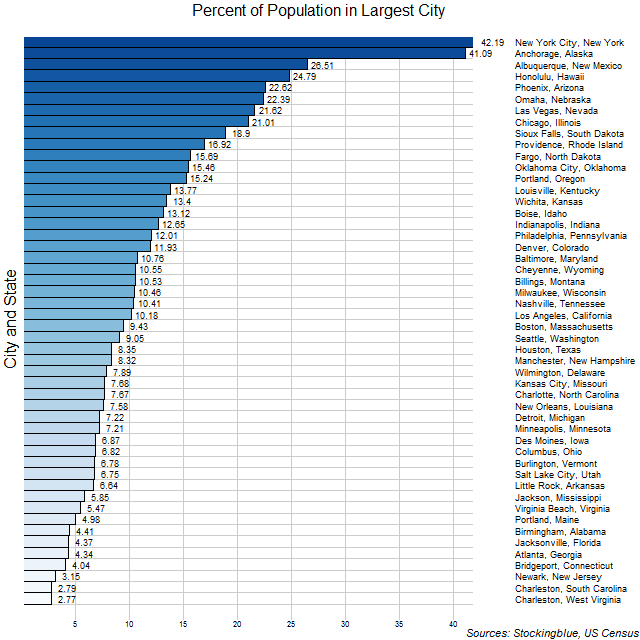
The chart above shows the most populous city in each US state and the proportion of that state's population that resides there. Unlike in the European Union were 14 states have over one-quarter of their population living in the most populous city, only three states do so in the US. In the US, living in a state's largest city is not as prevalent.
Proportion of Most Populous Cities in EU States
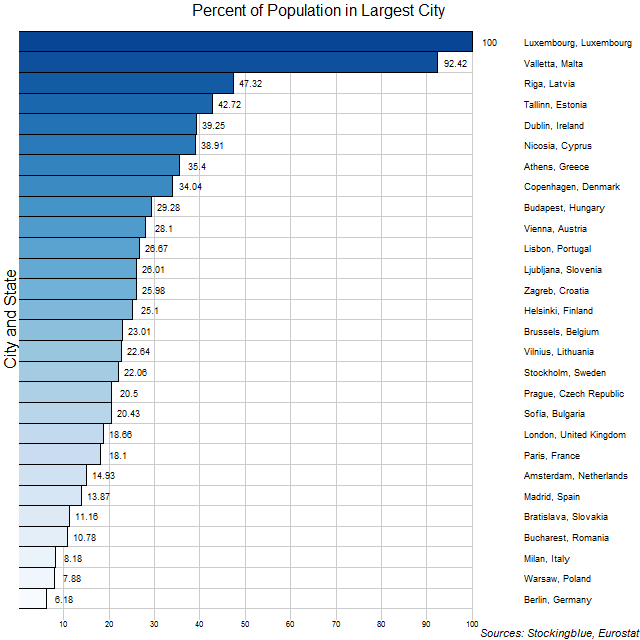
The chart above shows the most populous city in each EU state and the proportion of that nation's population that resides there. Luxembourg and Malta are obvious outliers due to their size but the rest of the EU still has quite a range from Berlin which only consists of just over one out of every twenty Germans to Riga which consists of just under one out of two Latvians.
OlderNewer