Gross Domestic Product by Land Area Worldwide
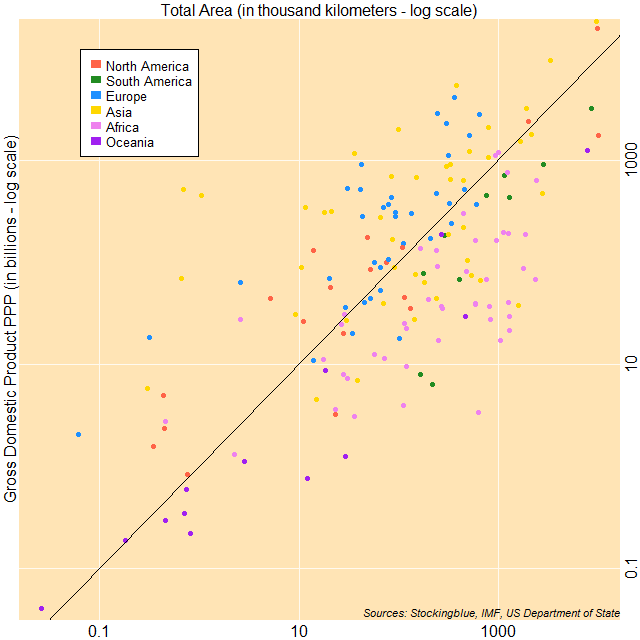
The chart above shows economic output as it relates to land area. The countries to the top left of the diagonal line have a gross domestic product (GDP) of over one million international dollars per square kilometer, while countries to the bottom right have a GDP that is less than one million dollars per square kilometer. Asia has the countries with the largest ratios of GDP to area whereas the Africa has the countries with the smallest ratios of GDP to area.
Gross Domestic Product by Land Area in Oceania
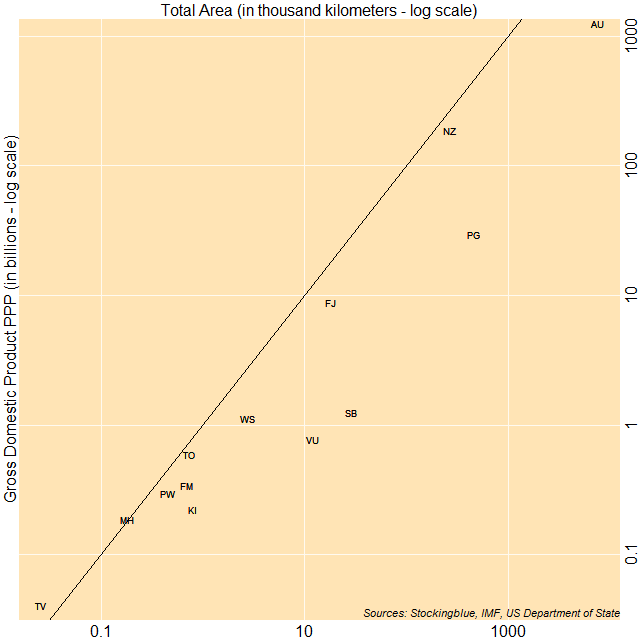
The chart above shows economic output as it relates to land area. The countries to the top left of the diagonal line have a gross domestic product (GDP) of over one million international dollars per square kilometer, while countries to the bottom right have a GDP that is less than one million dollars per square kilometer. Tuvalu, the Marshall Islands, and Tonga have the largest ratio of GDP to area whereas the Solomon Islands, Vanuatu, and Papua New Guinea have the smallest ratio of GDP to area.
Gross Domestic Product by Land Area in Africa
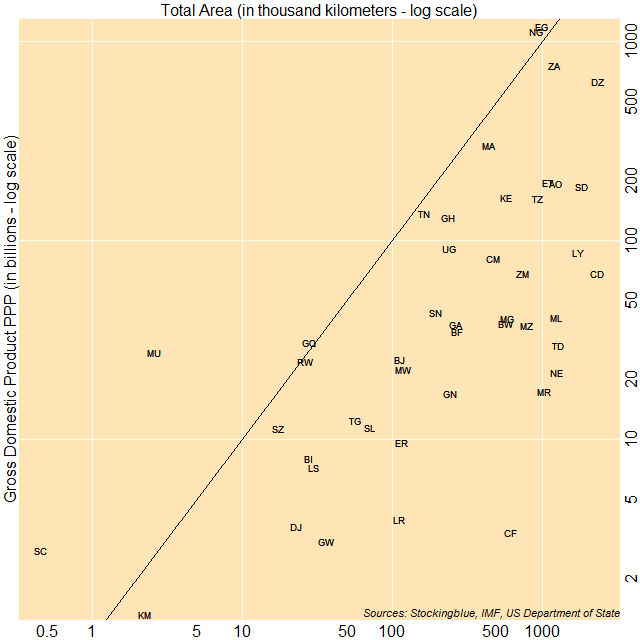
The chart above shows economic output as it relates to land area. The countries to the top left of the diagonal line have a gross domestic product (GDP) of over one million international dollars per square kilometer, while countries to the bottom right have a GDP that is less than one million dollars per square kilometer. Mauritius, Seychelles, and Nigeria have the largest ratio of GDP to area whereas the Central African Republic, Mauritania, and Niger have the smallest ratio of GDP to area.
Gross Domestic Product by Land Area in Asia
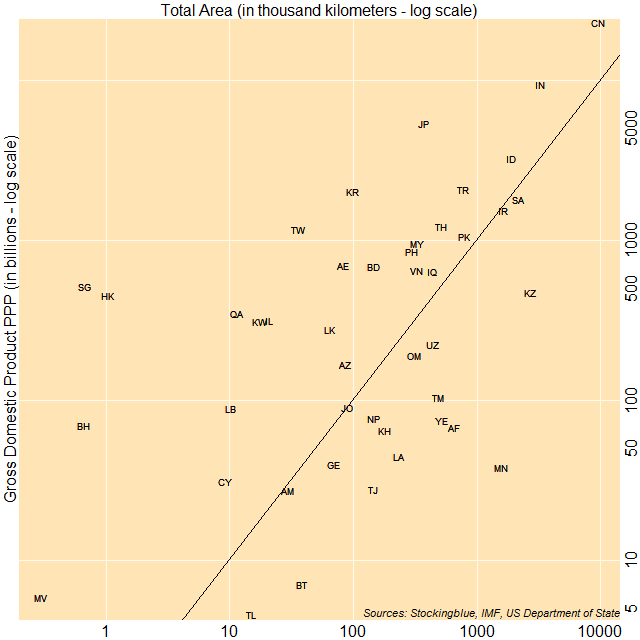
The chart above shows economic output as it relates to land area. The countries to the top left of the diagonal line have a gross domestic product (GDP) of over one million international dollars per square kilometer, while countries to the bottom right have a GDP that is less than one million dollars per square kilometer. Singapore, Hong Kong, and Bahrain have the largest ratio of GDP to area whereas Mongolia, Afghanistan, and Yemen have the smallest ratio of GDP to area.
Gross Domestic Product by Land Area in Europe
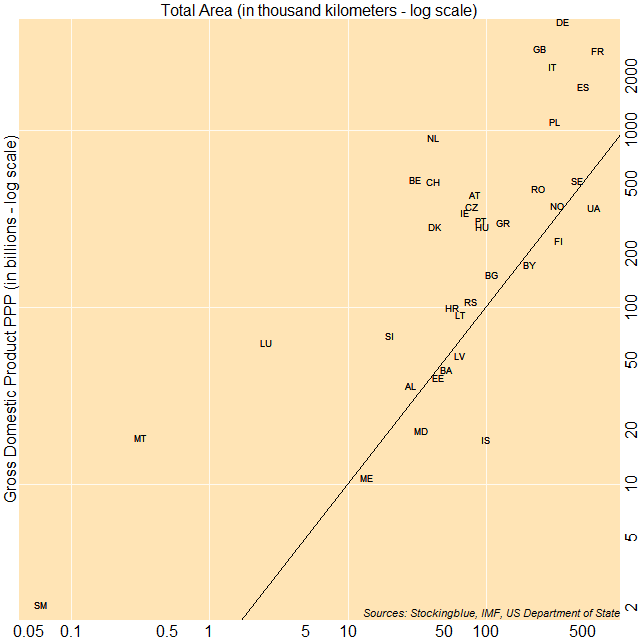
The chart above shows economic output as it relates to land area. The countries to the top left of the diagonal line have a gross domestic product (GDP) of over one million international dollars per square kilometer, while countries to the bottom right have a GDP that is less than one million dollars per square kilometer. Malta, San Marino, and Luxembourg have the largest ratio of GDP to area whereas Iceland, Moldova, and Ukraine have the smallest ratio of GDP to area.
Gross Domestic Product by Land Area in South America
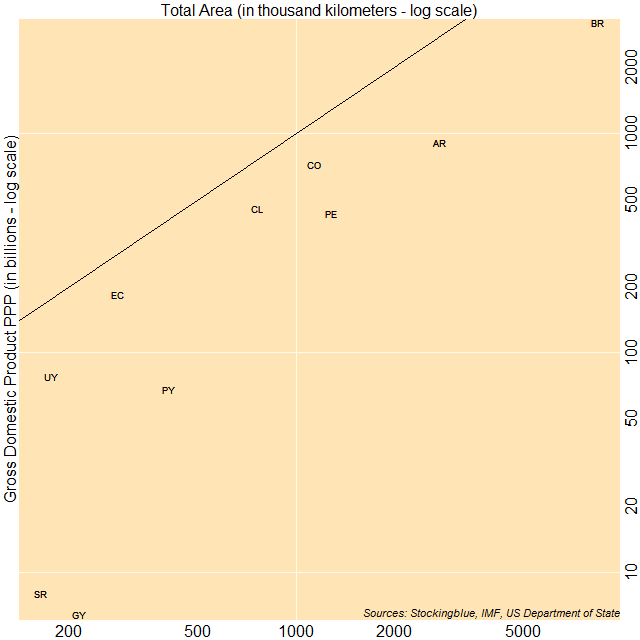
The chart above shows economic output as it relates to land area. The countries to the top left of the diagonal line have a gross domestic product (GDP) of over one million international dollars per square kilometer, while countries to the bottom right have a GDP that is less than one million dollars per square kilometer. Ecuador, Colombia, and Chile have the largest ratio of GDP to area whereas Paraguay, Suriname, and Guyana have the smallest ratio of GDP to area.
Gross Domestic Product by Land Area in North America
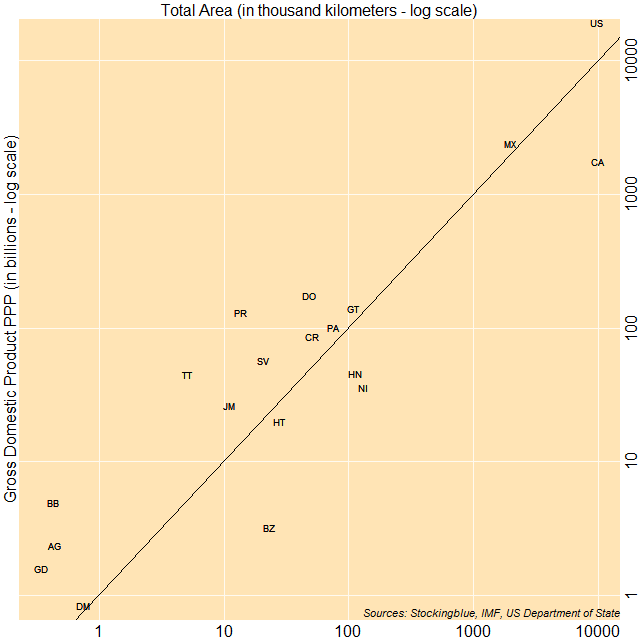
The chart above shows economic output as it relates to land area. The countries to the top left of the diagonal line have a gross domestic product (GDP) of over one million international dollars per square kilometer, while countries to the bottom right have a GDP that is less than one million dollars per square kilometer. Puerto Rico, Trinidad and Tobago, and Barbados have the largest ratio of GDP to area whereas Nicaragua, Canada, and Belize have the smallest ratio of GDP to area.
The Correlation between Minimum Wage and Shadow Economies Worldwide
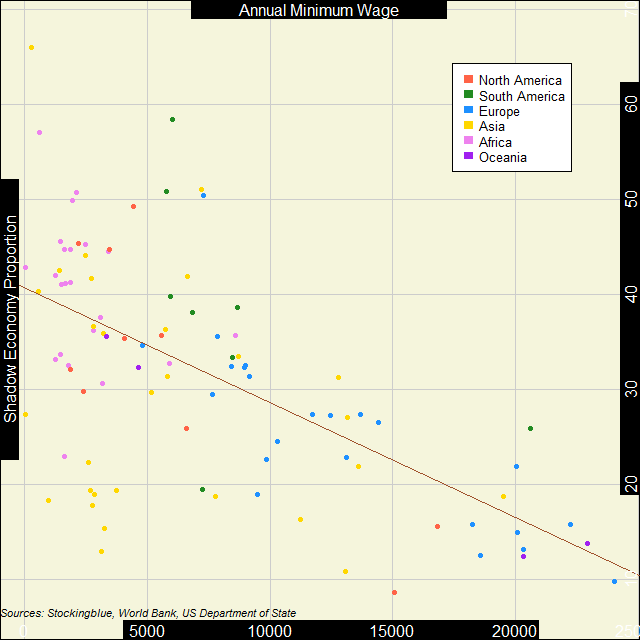
Worldwide, the inverse correlation between the strength of the shadow economy and the minimum wage is pretty strong. As the proportion of the shadow economy decreases, the minimum wage tends to go up.
The Correlation between Minimum Wage and Shadow Economies in Oceania
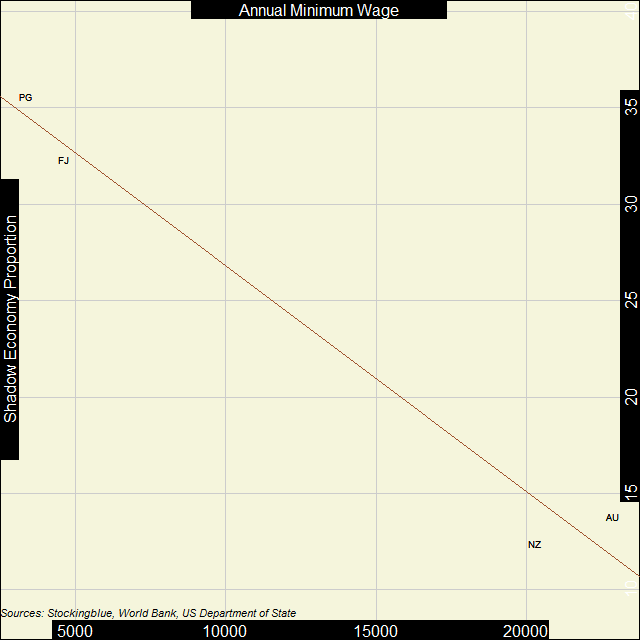
In Oceania, the inverse correlation between the strength of the shadow economy and the minimum wage is extremely strong. However, the sample size if four countries so it needs more data.
The Correlation between Minimum Wage and Shadow Economies in Africa
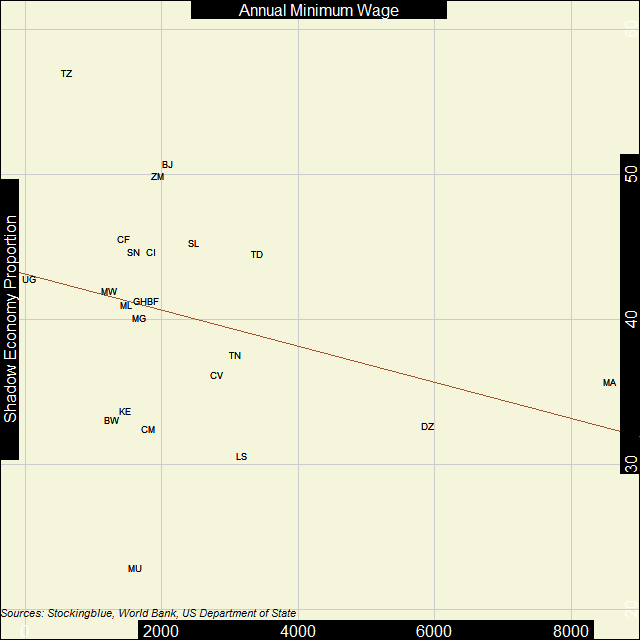
In Africa, the inverse correlation between the strength of the shadow economy and the minimum wage is very weak. There is no real relationship between the strength of the shadow economy and minimum wage.
OlderNewer