US Unemployment Rates, May 2020
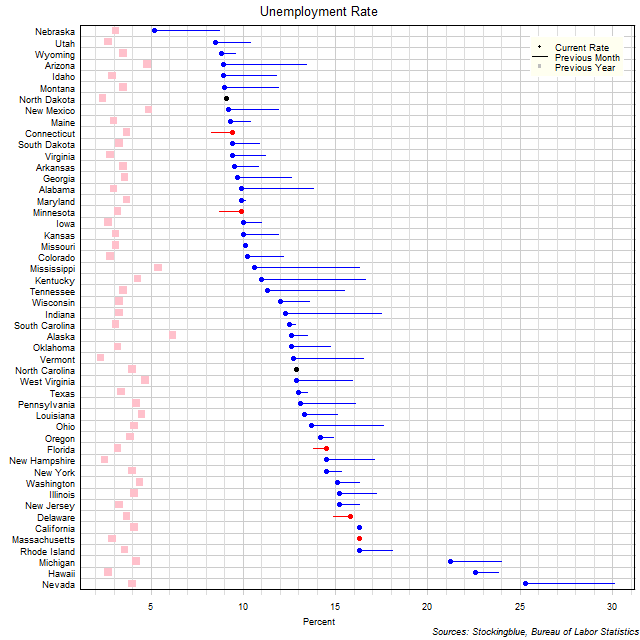
The chart above shows the unemployment rate in each US state as of May 2020, the change from the previous month, and the rate one year prior. The unemployment rate has slowly rebounded in most states however only Nebraska has an unemployment rate below eight percent.
EU Long-Term Interest Rates, May 2020
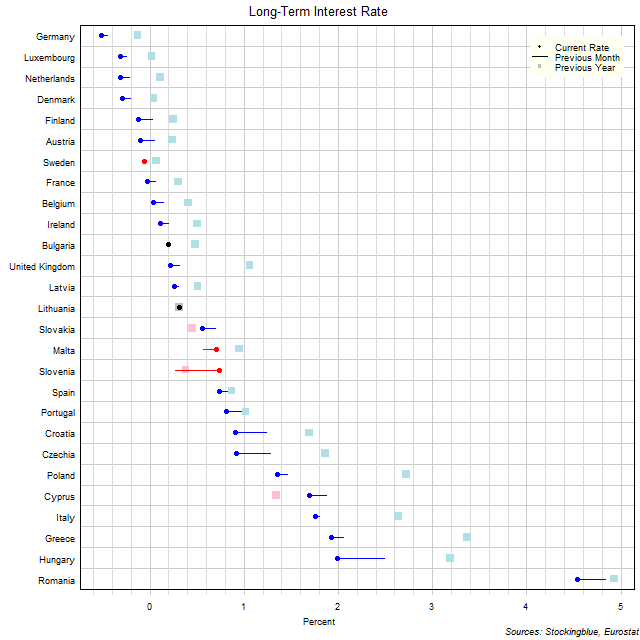
The chart above shows the ten-year interest rate in each EU state as of May 2020, the change from the previous month, and the rate one year prior. Eight states have a negative interest rate (up from five last month and up from one last year).
Treasury Rate Movements, June 2020
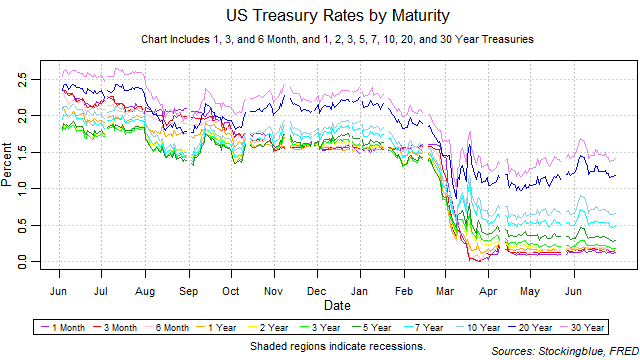
The one, three, five, and seven-year rates fell while the one and six-month and the two, 20, and 30-year rates remained the same, and the three-month and ten-year rates rose in June. The yield curve remained unchanged from the previous month thus ending its widening streak of one month. The one-month bill maintained the lowest rate throughout the month. There were no drastic moves upwards on short-term rates thus decreasing the risk of an inversion brought upon by rising short-term rates. Such an inversion, if it were to happen would be a strong indicator for an upcoming recession.
Long-Term EU and US GDP Growth Rate by Region, Fourth Quarter 2019
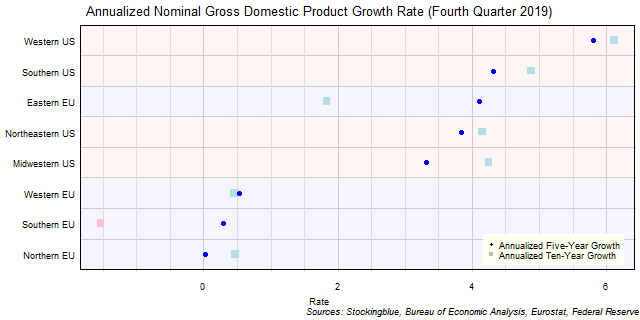
The chart above shows the annualized nominal gross domestic product (GDP) growth rate when priced in US dollars in each EU and US region over the past five years as of the fourth quarter of 2019 and the growth over the past ten years. All negative growth rates in the EU are attributed to currency rate fluctuations.
Long-Term EU GDP Growth Rate by Region, Fourth Quarter 2019

The chart above shows the annualized nominal gross domestic product (GDP) growth rate in each EU region over the past five years as of the fourth quarter of 2019 and the growth rate over the past ten years. The Western and Northern EU had a slower growth rate over the past five years than they had over the past ten years.
Long-Term US GDP Growth Rate by Region, Fourth Quarter 2019

The chart above shows the annualized nominal gross domestic product (GDP) growth rate in each US region over the past five years as of the fourth quarter of 2019 and the growth rate over the past ten years. All four regions grew over both time periods.
Long-Term EU and US GDP Growth Rate by State, Fourth Quarter 2019
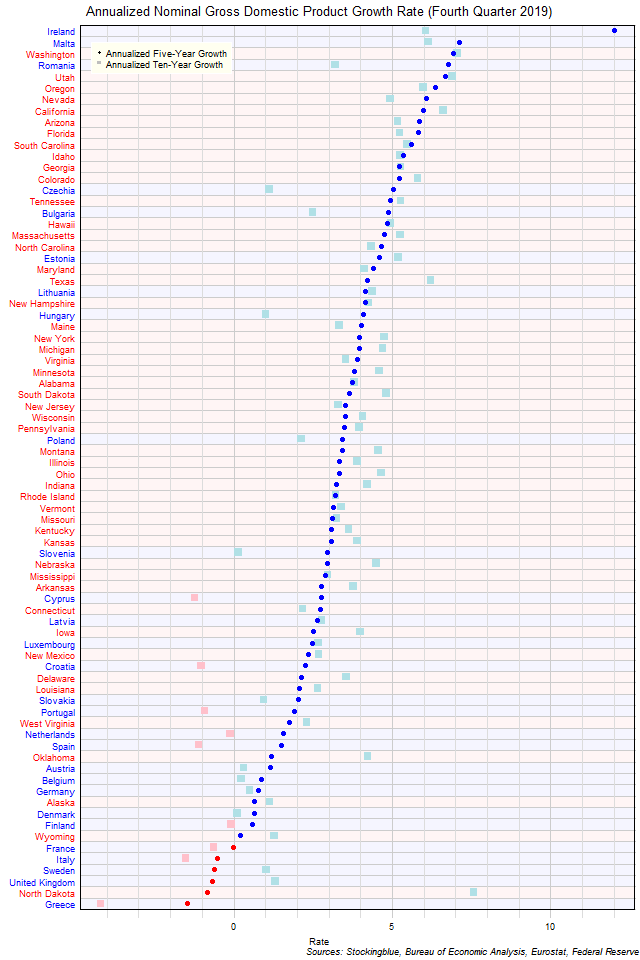
The chart above shows the annualized nominal gross domestic product (GDP) growth rate when the GDP is priced in US dollars in each EU and US state over the past five years as of the fourth quarter of 2019 and the growth rate over the past ten years. Only EU states saw a contraction both over the past five and ten years.
Long-Term EU GDP Growth Rate by State, Fourth Quarter 2019
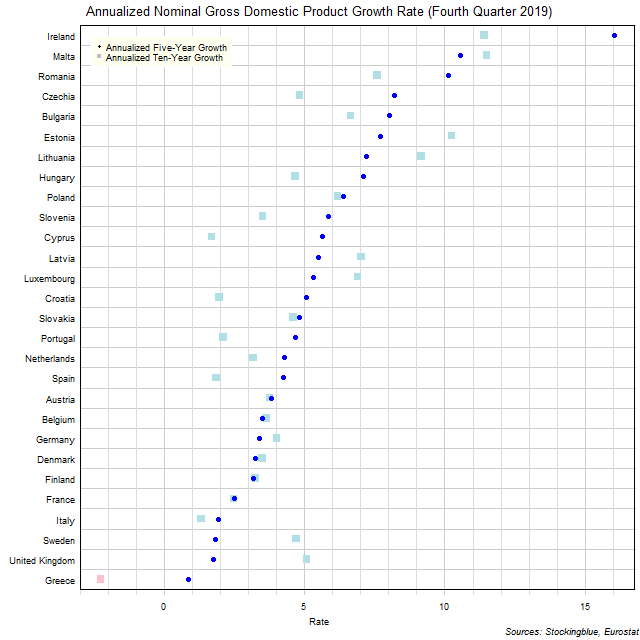
The chart above shows the annualized nominal gross domestic product (GDP) growth rate in each EU state over the past five years as of the fourth quarter of 2019 and the growth rate over the past ten years. Greece is the only state to experience negative growth over either period.
Long-Term US GDP Growth Rate by State, Fourth Quarter 2019
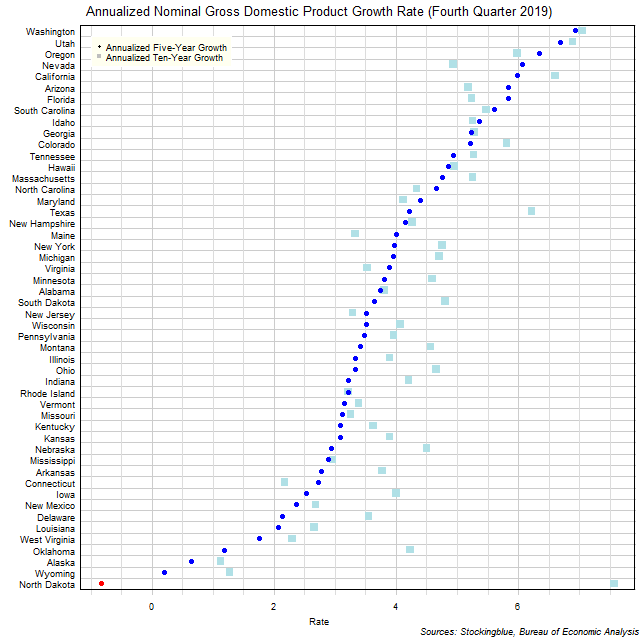
The chart above shows the annualized nominal gross domestic product (GDP) growth rate in each US state over the past five years as of the fourth quarter of 2019 and the growth rate over the past ten years. Only one state experienced negative growth in either time period.
Long-Term Per Capita GDP by EU and US Region, Fourth Quarter 2019
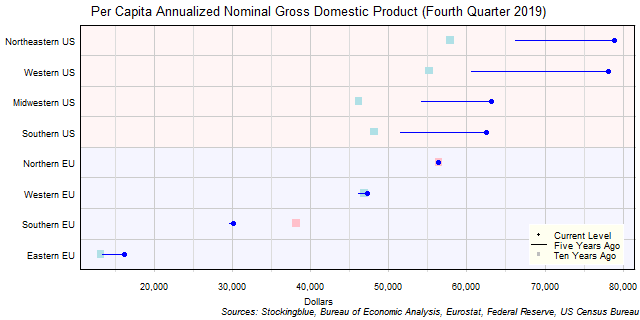
The chart above shows the per capita annualized nominal gross domestic product (GDP) in each EU and US region as of the fourth quarter of 2019 in US dollars, the change from five years ago, and the per capita GDP ten years prior. US regions have had a very good past five years.
OlderNewer