EU GDP Growth Rate by Region, Second Quarter 2019

The chart above shows the annualized nominal gross domestic product (GDP) quarterly growth rate in each EU region as of the second quarter of 2019 and the growth rate from one year prior. Every single region's economy grew both over the past quarter and the past year.
US GDP Growth Rate by Region, Second Quarter 2019

The chart above shows the annualized nominal gross domestic product (GDP) quarterly growth rate in each US region as of the second quarter of 2019 and the growth rate from one year prior. Every single region's economy grew both over the past quarter and the past year.
Treasury Rate Movements, November 2019
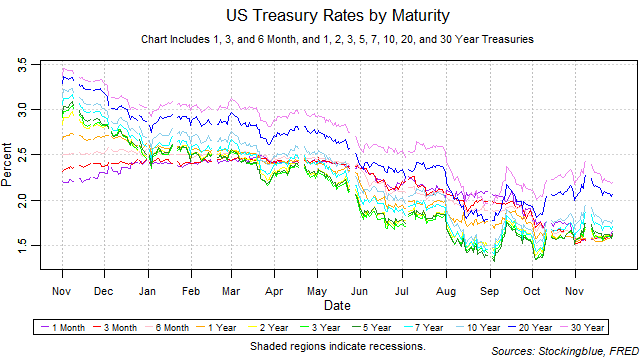
All rates rose rose in November. The yield curve narrowed from the previous month thus ending its widening streak at one month. The one-month bill held the lowest rate three times and shared the lowest rate one time in the month. All rates rose at an even pace thus decreasing the risk of an inversion brought upon by rising short-term rates. Such an inversion is a strong indicator for an upcoming recession.
EU and US GDP Growth Rate by State, Second Quarter 2019
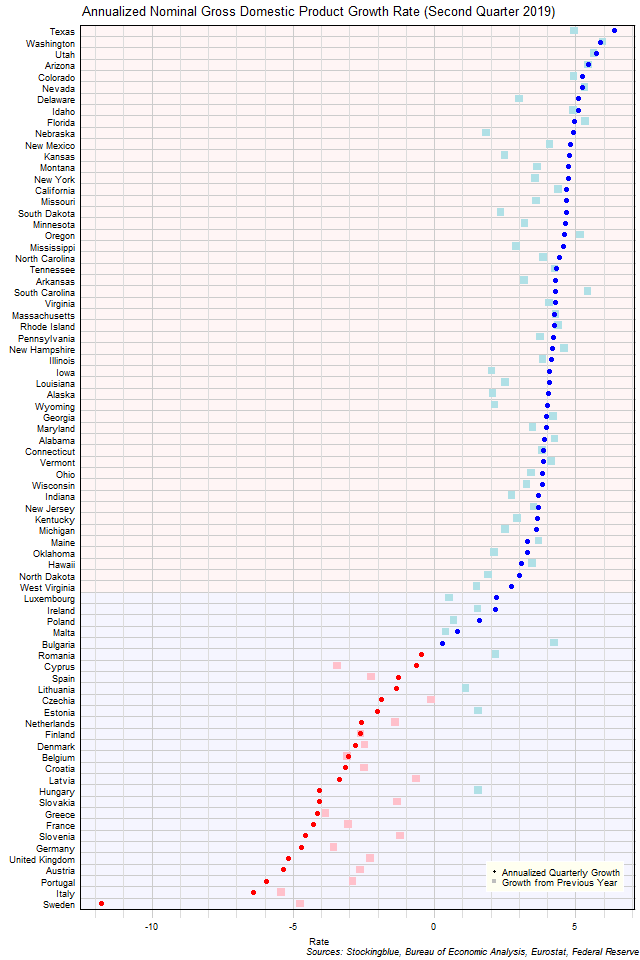
The chart above shows the annualized nominal gross domestic product (GDP) quarterly growth rate when the GDP is priced in US dollars in each EU and US state as of the second quarter of 2019 and the growth rate from one year prior. No US states had any negative growth over the past quarter or year whereas 23 out of 28 EU states experienced negative growth in either the past quarter, past year, or both.
EU GDP Growth Rate by State, Second Quarter 2019
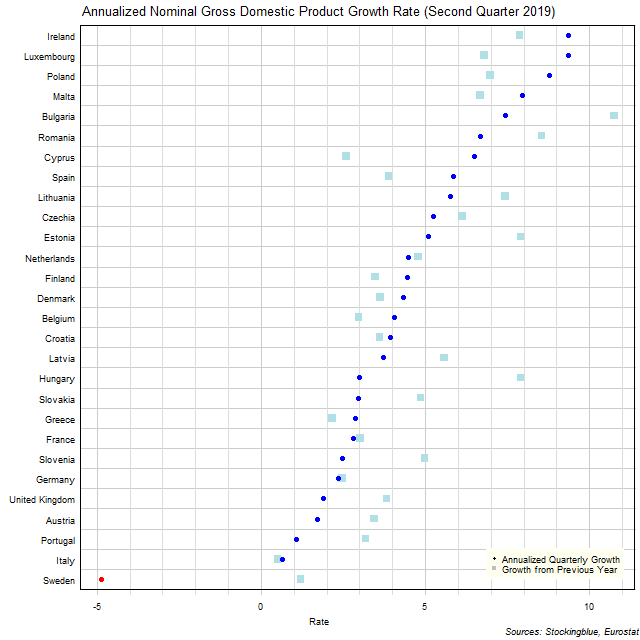
The chart above shows the annualized nominal gross domestic product (GDP) quarterly growth rate in each EU state as of the second quarter of 2019 and the growth rate from one year prior. Sweden was the only state to see a contraction over the previous quarter.
US GDP Growth Rate by State, Second Quarter 2019
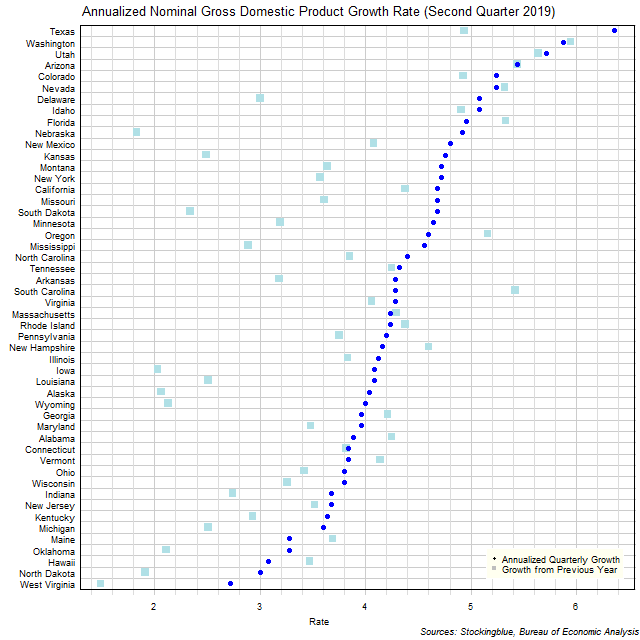
The chart above shows the annualized nominal gross domestic product (GDP) quarterly growth rate in each US state as of the second quarter of 2019 and the growth rate from one year prior. All states grew over the previous quarter and the same quarter last year.
Per Capita GDP by EU and US Region, Second Quarter 2019
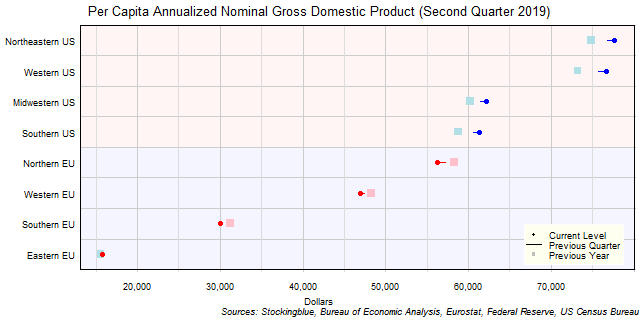
The chart above shows the per capita annualized nominal gross domestic product (GDP) in each EU and US region as of the second quarter of 2019 in US dollars, the change from the previous quarter, and the per capita GDP one year prior. US regions have seen growth in per capita GDP over the same quarter last year and over the previous quarter.
Per Capita GDP by EU Region, Second Quarter 2019

The chart above shows the per capita annualized nominal gross domestic product (GDP) in each EU region as of the second quarter of 2019 in euros, the change from the previous quarter, and the per capita GDP one year prior. Every single region's economy grew both over the past quarter and the past year.
Per Capita GDP by US Region, Second Quarter 2019

The chart above shows the per capita annualized nominal gross domestic product (GDP) in each US region as of the second quarter of 2019 in dollars, the change from the previous quarter, and the per capita GDP one year prior. Every single region's economy grew both over the past quarter and the past year.
Per Capita GDP by EU and US State, Second Quarter 2019
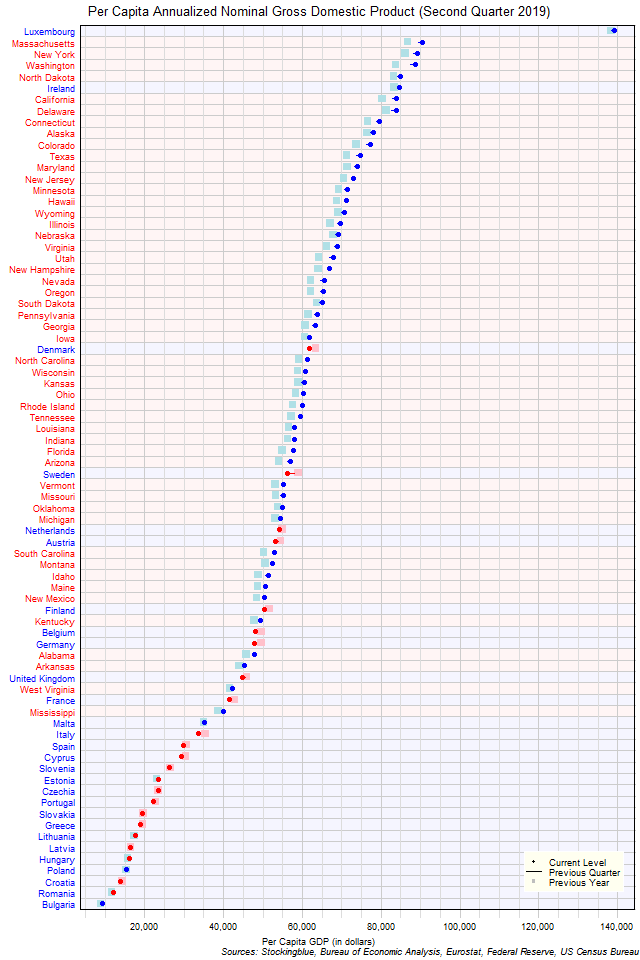
The chart above shows the per capita annualized nominal gross domestic product (GDP) in each EU and US state as of the second quarter of 2019 in dollars, the change from the previous quarter, and the GDP one year prior. Luxembourg is in a class all by itself.
OlderNewer