EU and US Unemployment Rates, September 2021
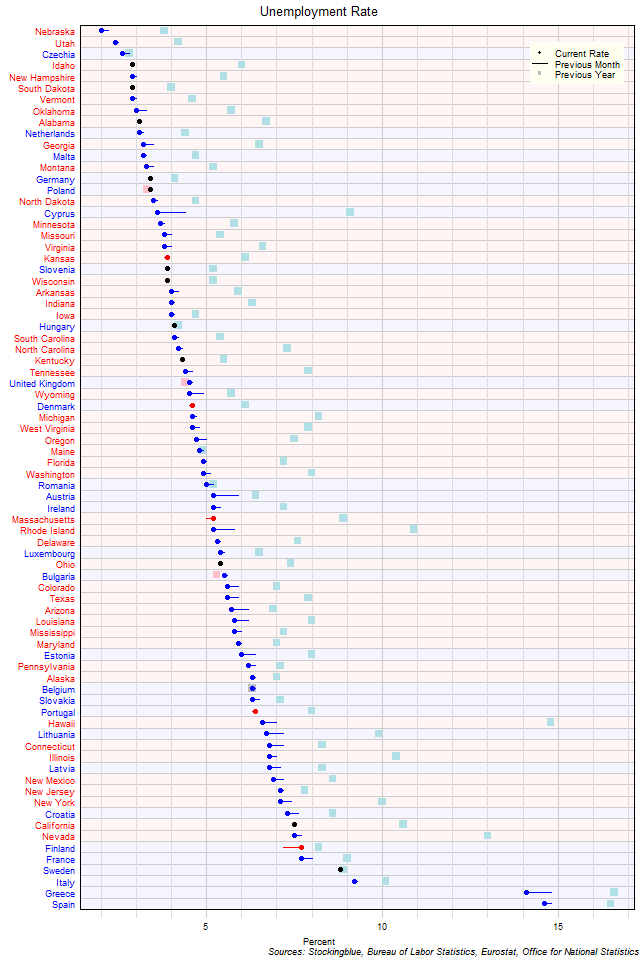
The chart above shows the unemployment rate in each EU and US state as of September 2021 (unless otherwise noted - see caveats below), the change from the previous month, and the rate one year prior. Czechia, Idaho, Nebraska, New Hampshire, South Dakota, Utah, and Vermont are the only states with a rate below three percent.
EU Unemployment Rates, September 2021
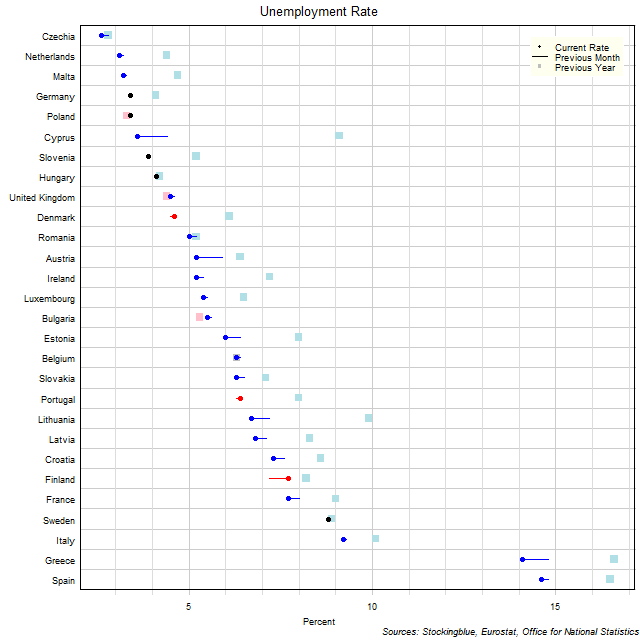
The chart above shows the unemployment rate in each EU state as of September 2021 (unless otherwise noted - see caveats below), the change from the previous month, and the rate one year prior. One state has an unemployment rate below three percent.
US Unemployment Rates, September 2021
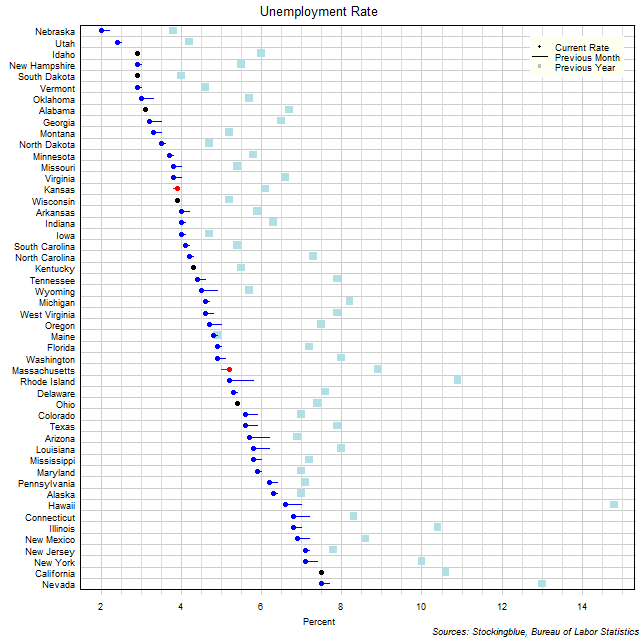
The chart above shows the unemployment rate in each US state as of September 2021, the change from the previous month, and the rate one year prior. Six states have an unemployment rate below three percent.
EU Long-Term Interest Rates, September 2021
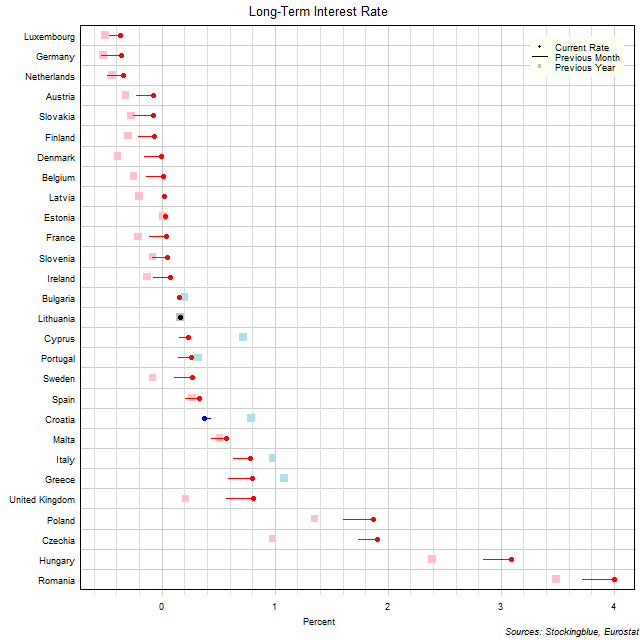
The chart above shows the ten-year interest rate in each EU state as of September 2021, the change from the previous month, and the rate one year prior. Seven states have a negative interest rate (down from 11 last month and down from 13 last year).
Treasury Rate Movements, October 2021
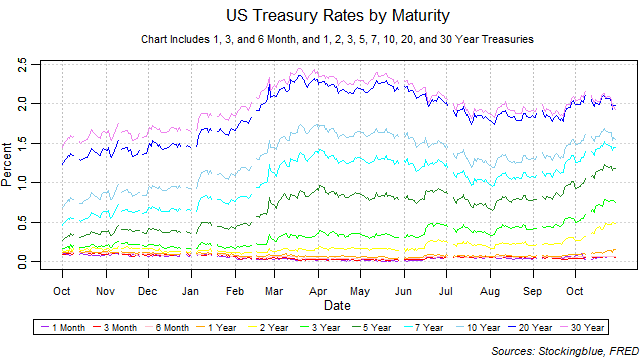
The one-month, 20-year, and 30-year rates fell while all other rates rose in October. The yield curve narrowed from the previous month thus ending its widening streak at two months. The one-month bill did not maintain the lowest rate throughout the month and it shared the lowest rate on multiple occasions. There were moves upwards on short-term rates thus increasing the risk of an inversion brought upon by rising short-term rates. Such an inversion, if it were to happen would be a strong indicator for an upcoming recession.
EU and US GDP by Region, Second Quarter 2021
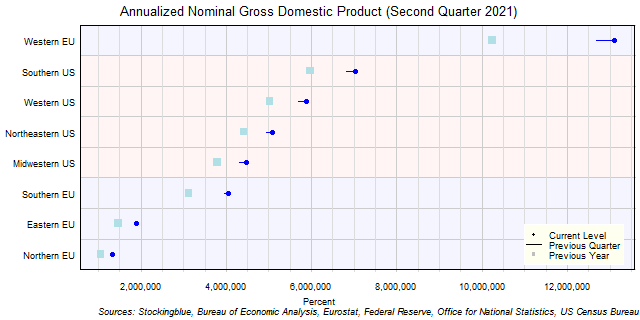
The chart above shows the annualized nominal gross domestic product (GDP) in each EU and US region as of the second quarter of 2021 in millions of dollars, the change from the previous quarter, and the GDP one year prior. Every single region's economy grew over the past quarter.
EU GDP by Region, Second Quarter 2021

The chart above shows the annualized nominal gross domestic product (GDP) in each EU region as of the second quarter of 2021 in millions of euros, the change from the previous quarter, and the GDP one year prior. All four regions grew over the previous quarter.
US GDP by Region, Second Quarter 2021

The chart above shows the annualized nominal gross domestic product (GDP) in each US region as of the second quarter of 2021 in millions of dollars, the change from the previous quarter, and the GDP one year prior. Every single region's economy grew over the past quarter and the past year.
EU and US GDP by State, Second Quarter 2021
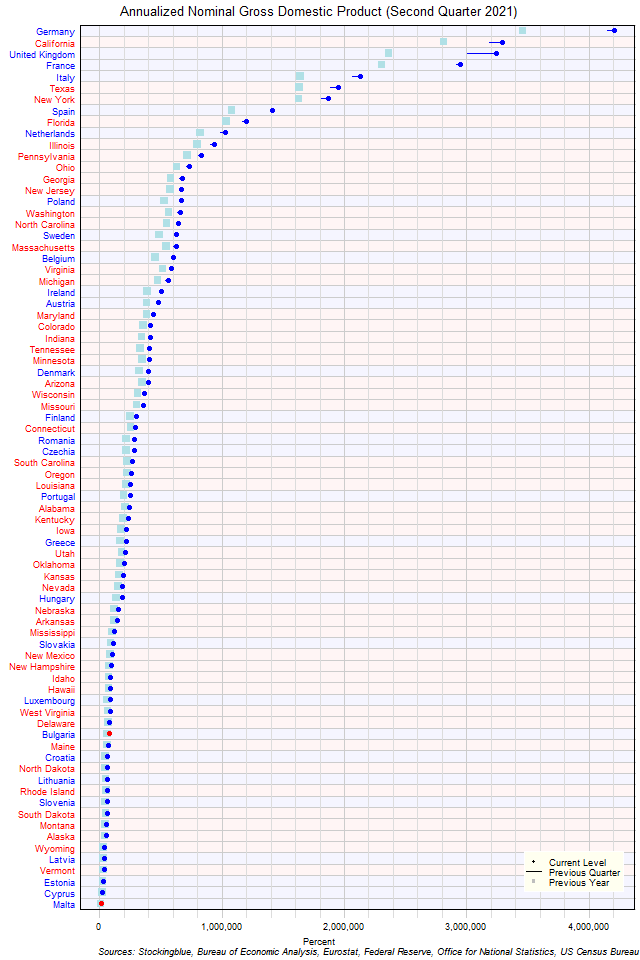
The chart above shows the annualized nominal gross domestic product (GDP) in each EU and US state as of the second quarter of 2021 in millions of US dollars, the change from the previous quarter, and the GDP one year prior. Every single state except for Bulgaria and Malta had an increase in GDP over the previous quarter.
EU GDP by State, Second Quarter 2021
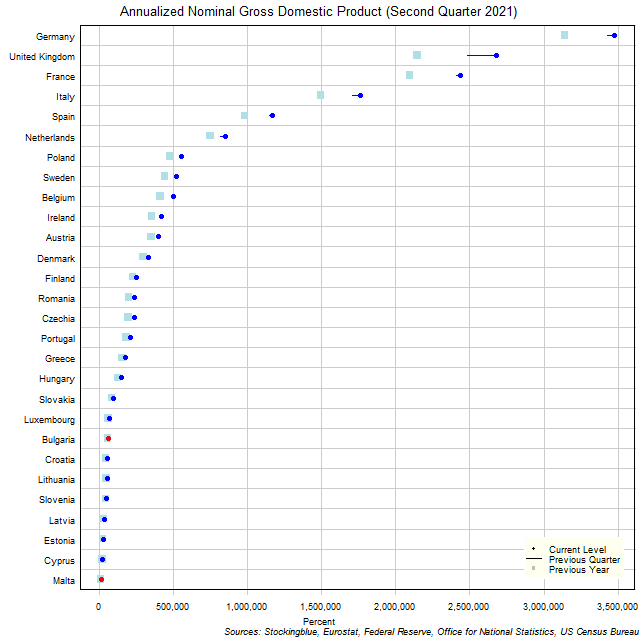
The chart above shows the annualized nominal gross domestic product (GDP) in each EU state as of the second quarter of 2021 in millions of euros, the change from the previous quarter, and the GDP one year prior. Only Bulgaria and Malta contracted over the previous quarter.
OlderNewer