Long-Term Per Capita GDP by US State, Fourth Quarter 2018
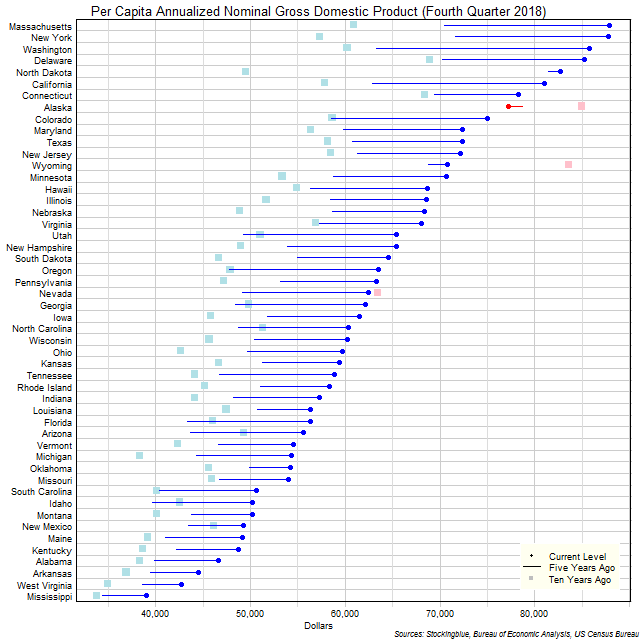
The chart above shows the per capita annualized nominal gross domestic product (GDP) in each US state as of the fourth quarter of 2018 in millions of dollars, the change from five years ago, and the per capita GDP ten years prior. Only three states have seen a drop in their per capita GDP either over the past five or ten years: Alaska, Wyoming, and Nevada.
US President with a Parliamentary System
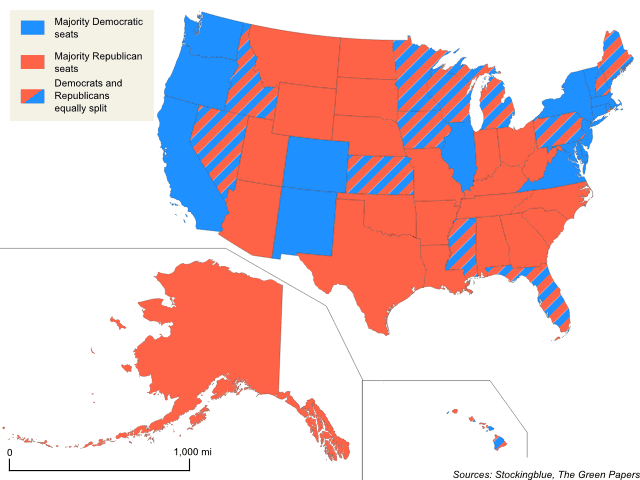
Yesterday's post looked into who would win the European Commission Presidency if the EU had an electoral college. Today's post flips the script and looks at who would be President, or rather, Prime Minister if the US had a parliamentary system. The map above shows which party would have the most seats in each state with a total of 435 seats and 218 needed to win. Since so many states came so close, they split the seats between Democrats and Republicans. In addition, three other parties make it into parliament, with the Libertarians, the Greens, and Utah's independent candidate Evan McMullin also gaining seats.
EU Commission President with an Electoral College System
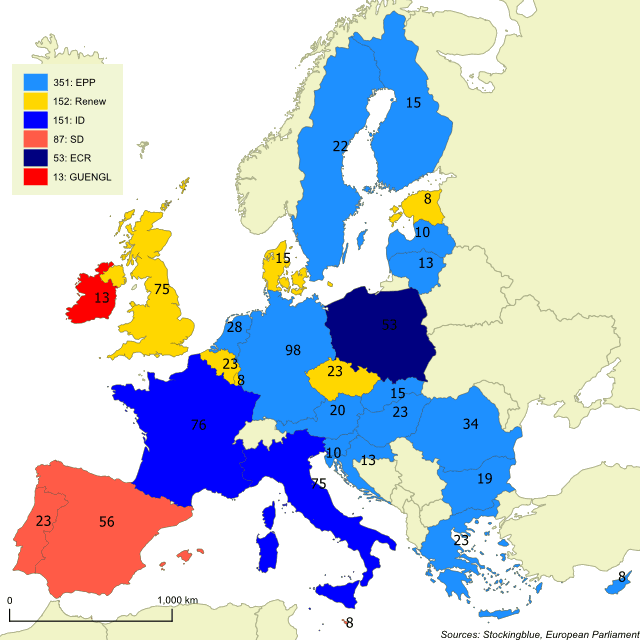
Recently, the European Union (EU) held an election to decide the representatives in the EU Parliament, the EU's equivalent to the House of Representatives in the US. After the election, a Commission President is selected based on the results and on input from another EU body (European Council) which consists of the heads of state of the 28 EU states. In this last election held on May 26, no party held a majority but the party with a plurality can attempt to form a coalition with other parties large enough to gain a majority. The results were so scattered however, that the three largest parties needed to form a coalition to gain a majority. Ultimately, they could not agree on a candidate to head the Commission and through backroom dealings, the European Council selected a candidate outside of the parties' leadership, and the Parliament voted her in this week. How would the election look if the EU had an electoral college? We take a look at the process below. The map above shows how many electors each party would get based on this election's results. Each state is given the number of representatives it has in the Parliament and one additional elector for each representative in the European Council and one for the Council of the European Union (so the number of parliamentarians plus two). These two bodies are not exact equivalents of our Senate, but in order to simplify the highly bureaucratic institutions of the EU, it will do for now. Another post looks at how the previous US presidential race would look with a parliamentary system.
EU and US Regional Unemployment Rates, May 2019
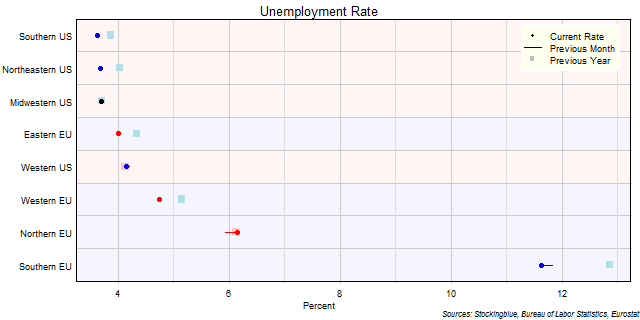
The chart above shows the unemployment rate in each EU and US region as of May 2019 (unless otherwise noted - see caveats below), the change from the previous month, and the rate one year prior. US regions continue to have considerably lower unemployment rates than EU regions with the Eastern EU being the only EU region that tops a US region.
US Regional Unemployment Rates, May 2019

The chart above shows the unemployment rate in each US region as of May 2019, the change from the previous month, and the rate one year prior. The Western US was the only region to not see an improvement in its rate from last year.
EU Regional Unemployment Rates, May 2019

The chart above shows the unemployment rate in each EU region as of May 2019 (unless otherwise noted - see caveats below), the change from the previous month, and the rate one year prior. The Northern EU is the only region with an unemployment rate larger than the previous month as well as larger than last year.
EU and US Unemployment Rates, May 2019
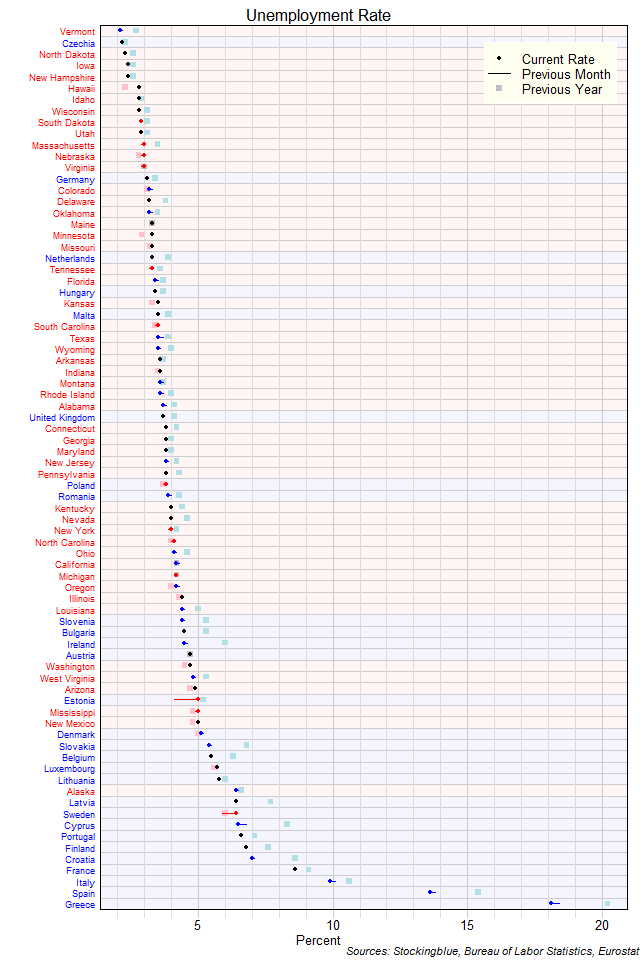
The chart above shows the unemployment rate in each EU and US state as of May 2019 (unless otherwise noted - see caveats below), the change from the previous month, and the rate one year prior. Czechia is the only EU state with an unemployment rate below three percent. Nine US states have a rate below three percent.
US Unemployment Rates, May 2019
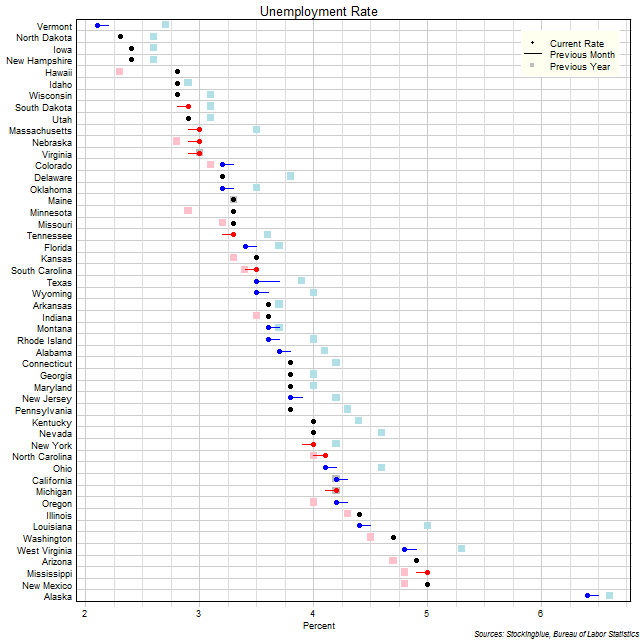
The chart above shows the unemployment rate in each US state as of May 2019, the change from the previous month, and the rate one year prior. Vermont is the only state that has an unemployment rate below 2.25 percent.
EU Unemployment Rates, May 2019
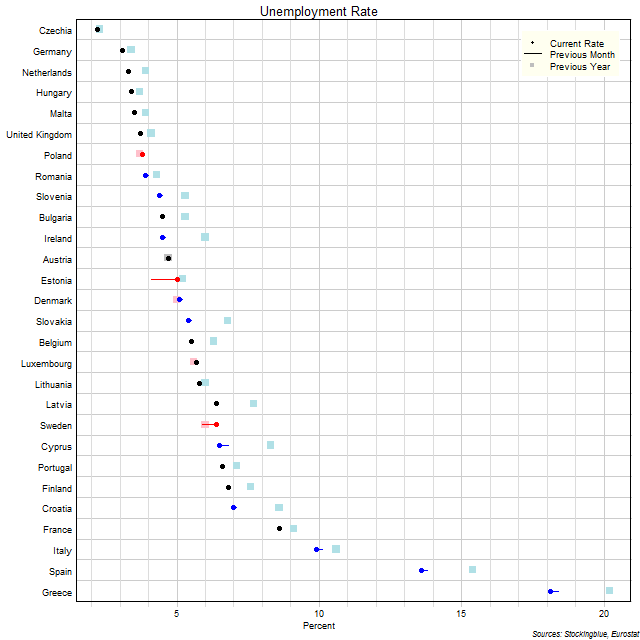
The chart above shows the unemployment rate in each EU state as of May 2019 (unless otherwise noted - see caveats below), the change from the previous month, and the rate one year prior. Czechia continues to be the only state with an unemployment rate below three percent.
Long-Term GDP by EU and US Region, Fourth Quarter 2018
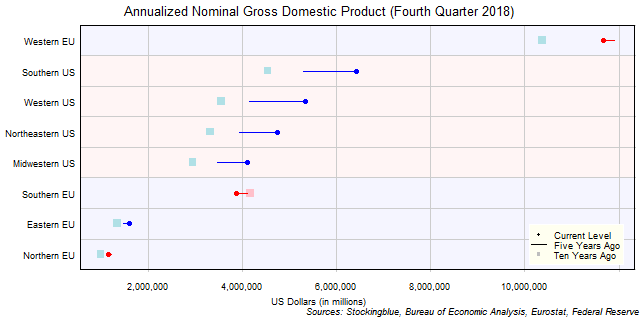
The chart above shows the annualized nominal gross domestic product (GDP) in each EU and US region as of the fourth quarter of 2018 in millions of US dollars, the change from five years ago, and the GDP ten years prior. The Southern, Western, and Northeastern US each grew by more over the past ten years than the entire GDP of the Eastern EU. Additionally, all four US regions and the Western EU each had an improvement in their GDP over the past ten years that is larger than the entire GDP of the Northern EU.
OlderNewer