Long-Term GDP by EU Region, Fourth Quarter 2018

The chart above shows the annualized nominal gross domestic product (GDP) in each EU region as of the fourth quarter of 2018 in millions of euros, the change from five years ago, and the GDP ten years prior. Every single region's economy grew both over the past five and ten years.
Long-Term GDP by US Region, Fourth Quarter 2018

The chart above shows the annualized nominal gross domestic product (GDP) in each US region as of the fourth quarter of 2018 in millions of dollars, the change from five years ago, and the GDP ten years prior. Every single region's economy grew both over the past five and ten years.
EU Long-Term Interest Rates, May 2019
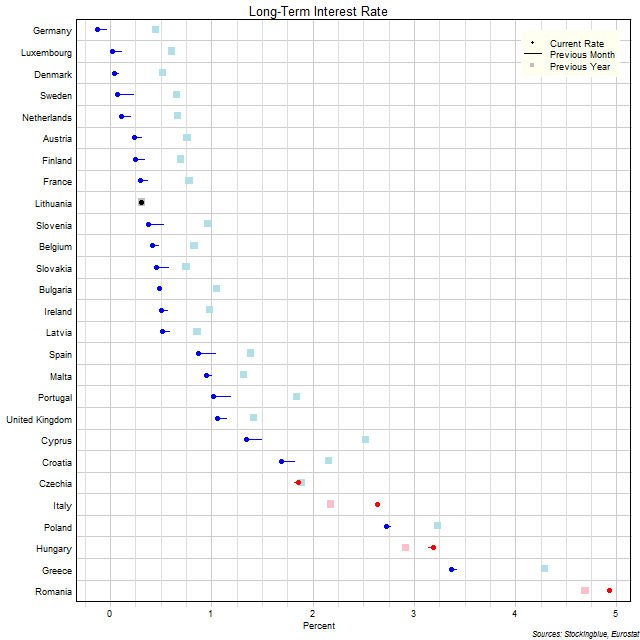
The chart above shows the ten-year interest rate in each EU state as of May 2019, the change from the previous month, and the rate one year prior. Germany continues to be the only state with a negative interest rate.
Treasury Rate Movements, June 2019
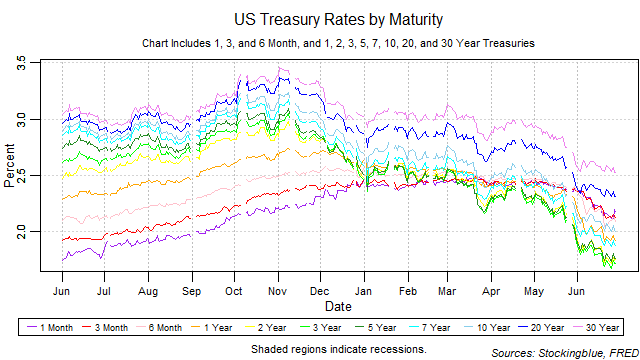
All rates fell in June. The yield curve widened from the previous month thus ending its one month narrowing streak. The one-month bill did not maintain the lowest rate at any point in the month. Long-term rates fell at a slower pace than short-term rates thus decreasing the risk of an inversion brought upon by rising short-term rates. Such an inversion, if it were to happen would be a strong indicator for an upcoming recession. A side note: several financial analysts have recently pointed to inversions between particular rates like the three-year note having a higher rate than the five-year note as being indicators for a recession. The data does not back this up. The only type of inversion that has led to a recession reliably is one in which the highest rate is a shorter-term treasury than the lowest rate. This is the only inversion that has predicted a recession seven out of eight times since 1962. According to this measure, there is no recession in the foreseeable future.
Long-Term GDP by EU and US State, Fourth Quarter 2018
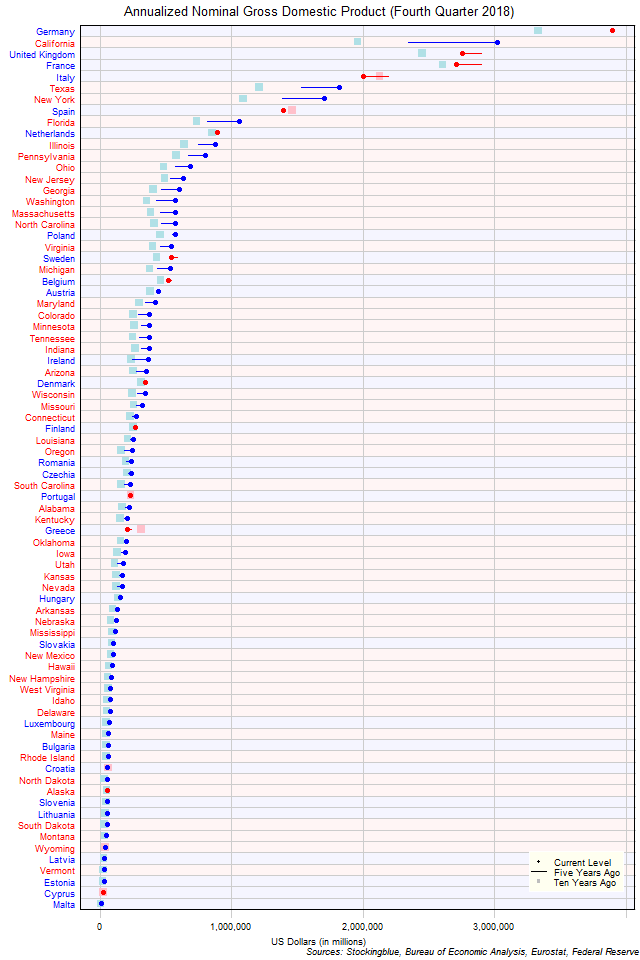
The chart above shows the annualized nominal gross domestic product (GDP) in each EU and US state as of the fourth quarter of 2018 in millions of US dollars, the change from five years ago, and the GDP ten years prior. Germany continues to be the largest economy but California is hot on its tail.
Long-Term GDP by EU State, Fourth Quarter 2018
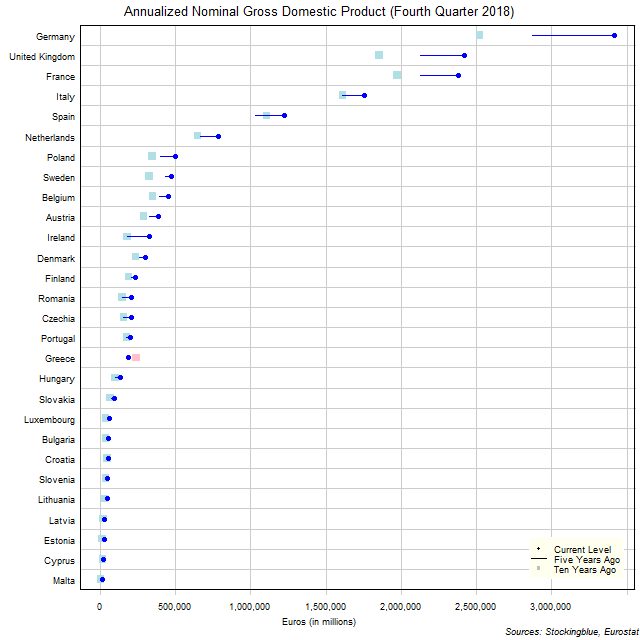
The chart above shows the annualized nominal gross domestic product (GDP) in each EU state as of the fourth quarter of 2018 in millions of euros, the change from five years ago, and the GDP ten years prior. Germany's economy grew more over the past five years than 22 states' entire GDP.
Long-Term GDP by US State, Fourth Quarter 2018
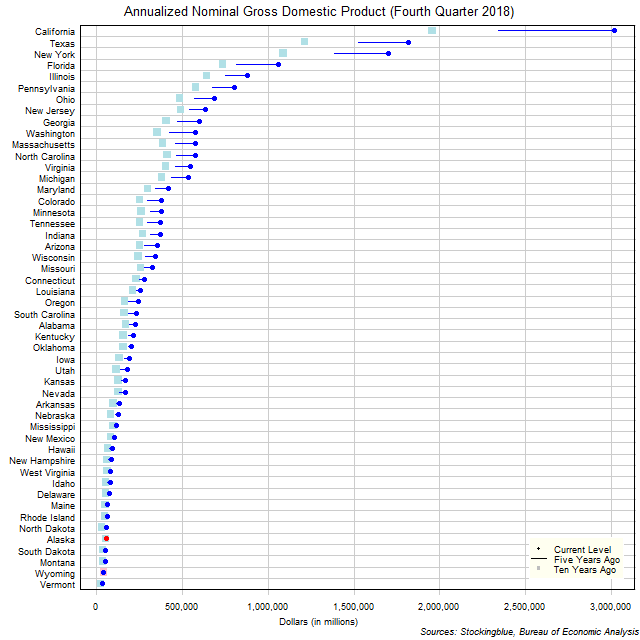
The chart above shows the annualized nominal gross domestic product (GDP) in each US state as of the fourth quarter of 2018 in millions of dollars, the change from five years ago, and the GDP ten years prior. California's economy grew more over the past five years than the size of 42 states' entire economies.
EU and US GDP Growth Rate by Region, Fourth Quarter 2018
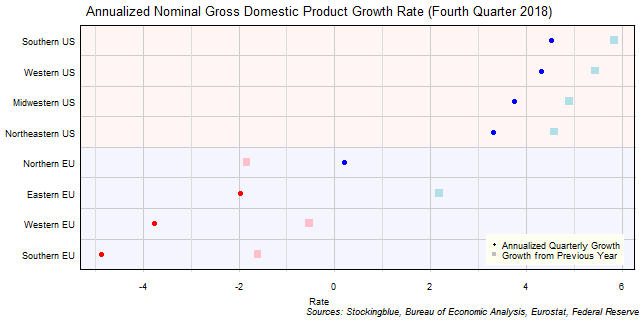
The chart above shows the annualized nominal gross domestic product (GDP) quarterly growth rate in each EU and US region as of the fourth quarter of 2018 and the growth rate from one year prior. All negative growth rates in the EU are attributed to currency rate fluctuations.
EU GDP Growth Rate by Region, Fourth Quarter 2018

The chart above shows the annualized nominal gross domestic product (GDP) quarterly growth rate in each EU region as of the fourth quarter of 2018 and the growth rate from one year prior. Every single region's economy grew both over the past quarter and the past year.
US GDP Growth Rate by Region, Fourth Quarter 2018

The chart above shows the annualized nominal gross domestic product (GDP) quarterly growth rate in each US region as of the fourth quarter of 2018 and the growth rate from one year prior. Every single region's economy grew both over the past quarter and the past year.
OlderNewer