US Regional Unemployment Rates, March 2019

The chart above shows the unemployment rate in each US region as of March 2019, the change from the previous month, and the rate one year prior. The Northeast was the only region to see an improvement in its rate both from last month and last year.
EU Regional Unemployment Rates, March 2019

The chart above shows the unemployment rate in each EU region as of March 2019 (unless otherwise noted - see caveats below), the change from the previous month, and the rate one year prior. The Northern EU is the only region with an unemployment rate larger than the previous month as well as larger than last year.
EU and US Unemployment Rates, March 2019
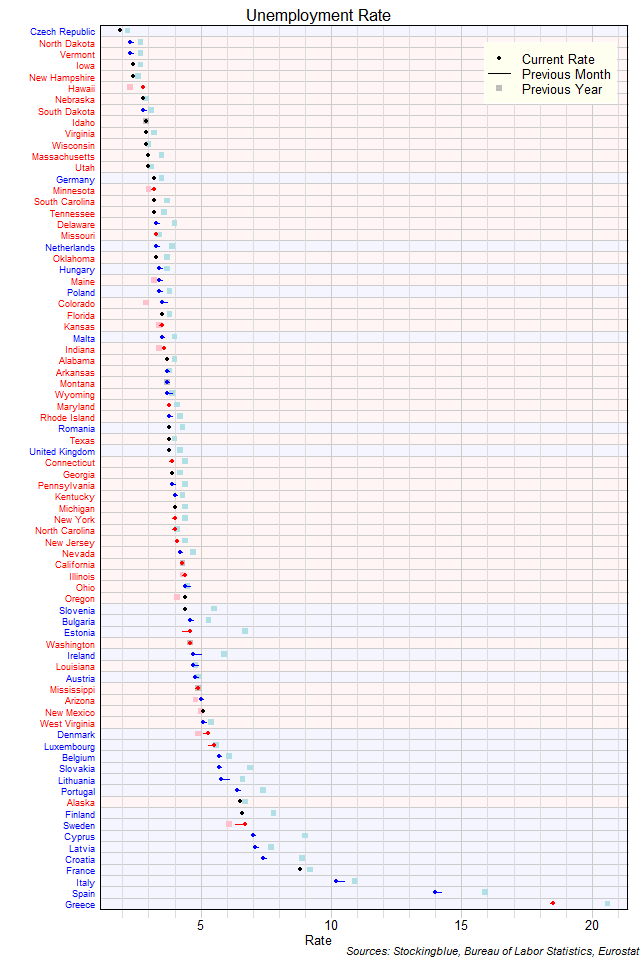
The chart above shows the unemployment rate in each EU and US state as of March 2019 (unless otherwise noted - see caveats below), the change from the previous month, and the rate one year prior. The Czech Republic continues to be the only state with an unemployment rate below two percent; it is also the only EU state with an unemployment rate below three percent. Ten US states have a rate below three percent.
US Unemployment Rates, March 2019
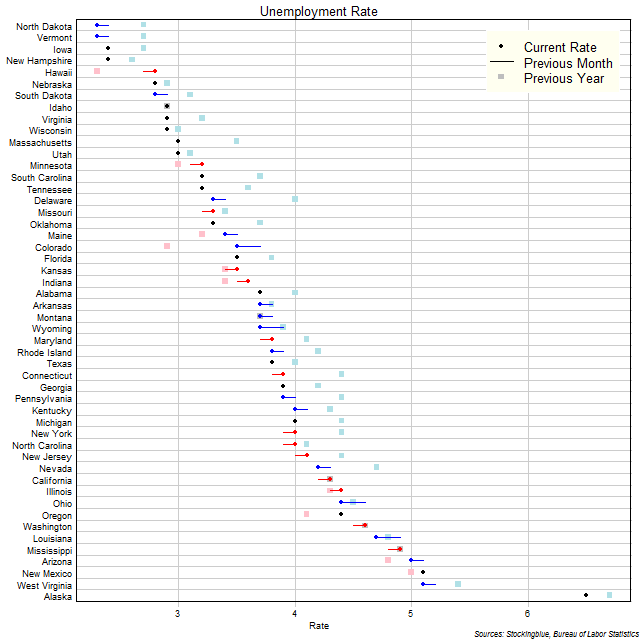
The chart above shows the unemployment rate in each US state as of March 2019, the change from the previous month, and the rate one year prior. Four states, Iowa, New Hampshire, North Dakota, and Vermont are the only states that continue to have an unemployment rate below 2.5 percent.
EU Unemployment Rates, March 2019
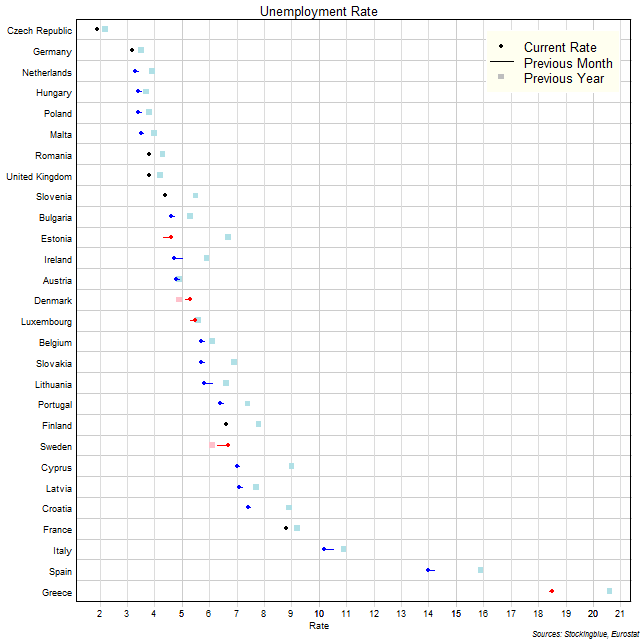
The chart above shows the unemployment rate in each EU state as of March 2019 (unless otherwise noted - see caveats below), the change from the previous month, and the rate one year prior. The Czech Republic continues to be the only state with an unemployment rate below three percent.
Treasury Rate Movements, April 2019
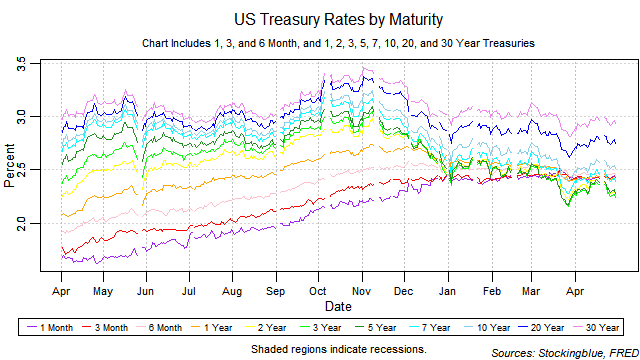
All rates except for the one-year bill rose in April. The yield curve grew from the previous month thus ending its one month narrowing streak. The one-month bill did not maintain the lowest rate at any point in the month. Long-term rates rose at a faster pace than short-term rates thus neutralizing the risk of an inversion brought upon by rising short-term rates. Such an inversion, if it were to happen would be a strong indicator for an upcoming recession. A side note: several financial analysts have recently pointed to inversions between particular rates like the three-year note having a higher rate than the five-year note as being indicators for a recession. The data does not back this up. The only type of inversion that has led to a recession reliably is one in which the highest rate is a shorter-term treasury than the lowest rate. This is the only inversion that has predicted a recession seven out of eight times since 1962. According to this measure, there is no recession in the foreseeable future.
EU and US Regions by Annual Riders per Mile of Subway Track
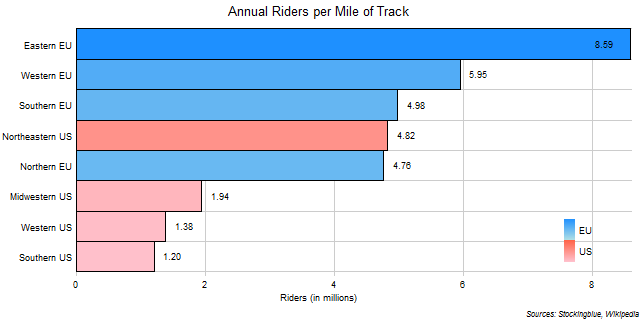
The chart above shows the number of annual riders for every mile of track in each EU and US region. One million annual riders is the equivalent of 2,740 riders a day. EU regions dominate in this metric.
EU Regions by Annual Riders per Kilometer of Subway Track

The chart above shows the number of annual riders for every kilometer of track in each EU region. One million annual riders is the equivalent of 2,740 riders a day. The Eastern EU is the only region with over 4 million annual riders for every kilometer of subway track.
US Regions by Annual Riders per Mile of Subway Track

The chart above shows the number of annual riders for every mile of track in each US region. One million annual riders is the equivalent of 2,740 riders a day. Unsurprisingly, the Northeast dominates in this metric.
EU and US States by Annual Riders per Mile of Subway Track
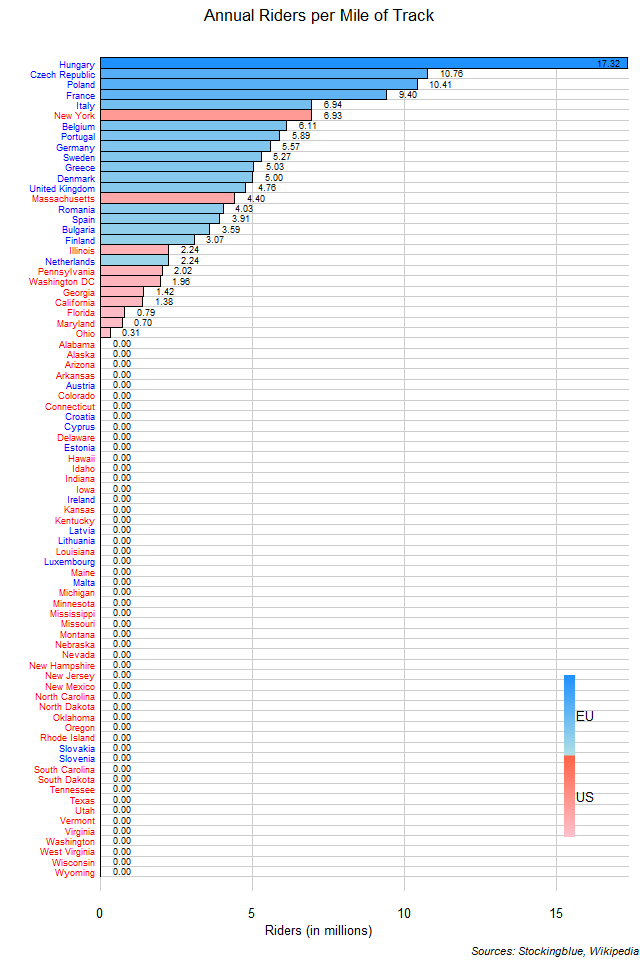
The chart above shows the number of annual riders for every mile of track in each state. One million annual riders is the equivalent of 2,740 riders a day. EU states tend to pack in more riders for every unit of track than US states do.
OlderNewer