EU States by Annual Riders per Kilometer of Subway Track
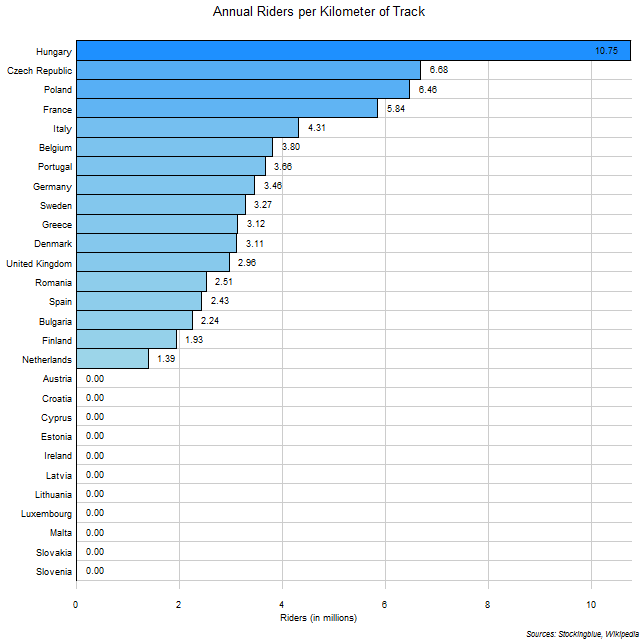
The chart above shows the number of annual riders for every kilometer of track in each state. One million annual riders is the equivalent of 2,740 riders a day. So the Netherlands has 3,808 daily riders for every kilometer of track while Hungary has 29,452.
US States by Annual Riders per Mile of Subway Track
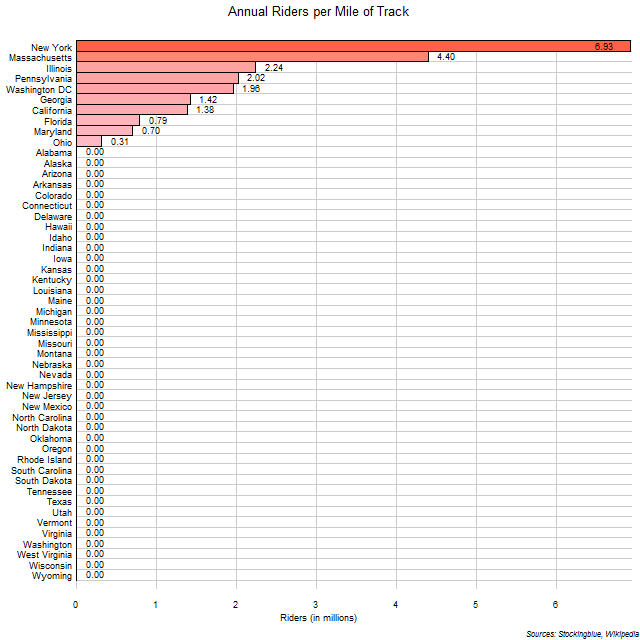
The chart above shows the number of annual riders for every mile of track in each state. One million annual riders is the equivalent of 2,740 riders a day. So Ohio has 849 daily riders for every mile of track while New York has 18,986.
EU and US Regions by Annual Riders per Subway Station
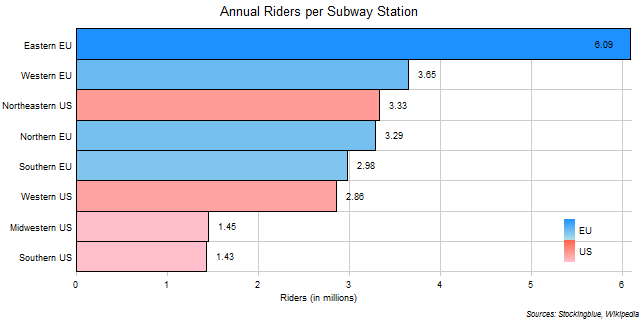
The chart above shows the number of annual riders for every subway station in each EU and US region. One million annual riders is the equivalent of 2,740 riders a day. The Eastern EU dominates all other regions.
EU Regions by Annual Riders per Subway Station

The chart above shows the number of annual riders for every subway station in each EU region. One million annual riders is the equivalent of 2,740 riders a day. The Eastern EU is in a class all its own.
US Regions by Annual Riders per Subway Station

The chart above shows the number of annual riders for every subway station in each US region. One million annual riders is the equivalent of 2,740 riders a day. Unsurprisingly, the Northeast leads in this metric.
EU and US States by Annual Riders per Subway Station
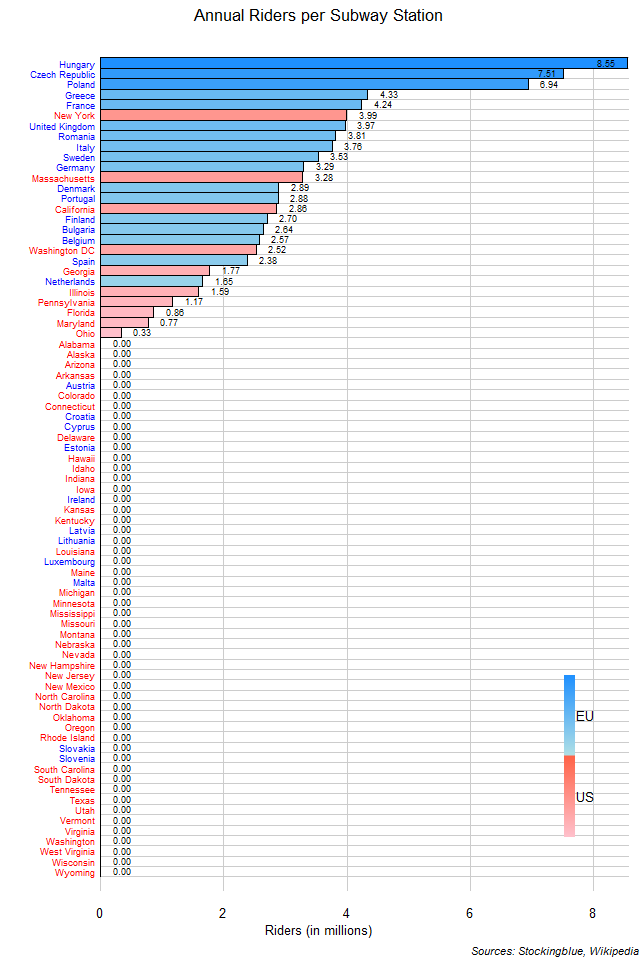
The chart above shows the number of annual riders for every subway station in each EU and US state. One million annual riders is the equivalent of 2,740 riders a day. So Ohio has 904 daily riders for every station while Hungary has 23,425.
EU States by Annual Riders per Subway Station
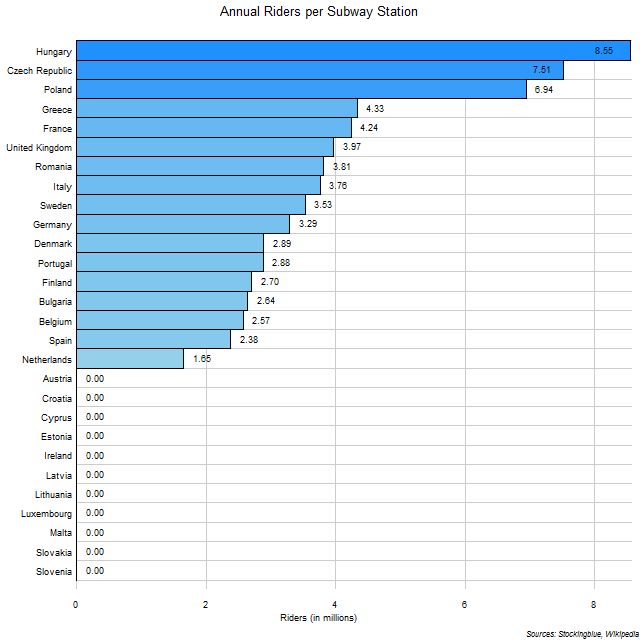
The chart above shows the number of annual riders for every subway station in each EU state. One million annual riders is the equivalent of 2,740 riders a day. So the Netherlands has 4,521 daily riders for every station while Hungary has 23,425.
US States by Annual Riders per Subway Station
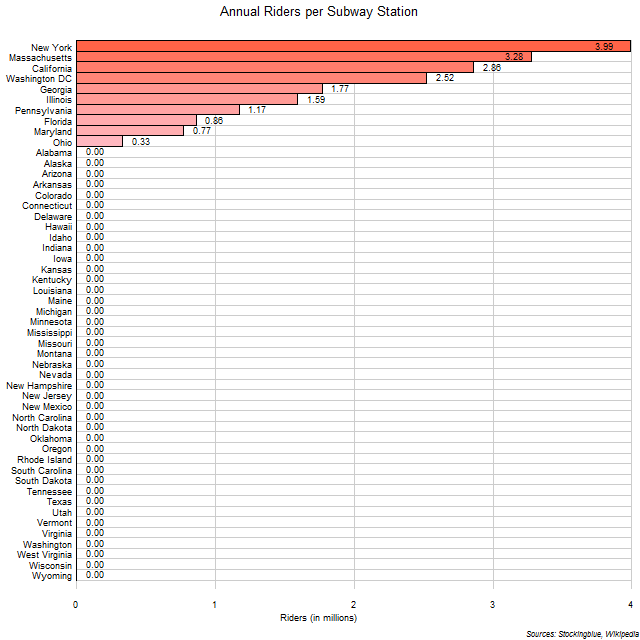
The chart above shows the number of annual riders for every subway station in each state. One million annual riders is the equivalent of 2,740 riders a day. So Ohio has 904 daily riders for every station while New York has 10,932.
EU and US Regional Unemployment Rates, February 2019
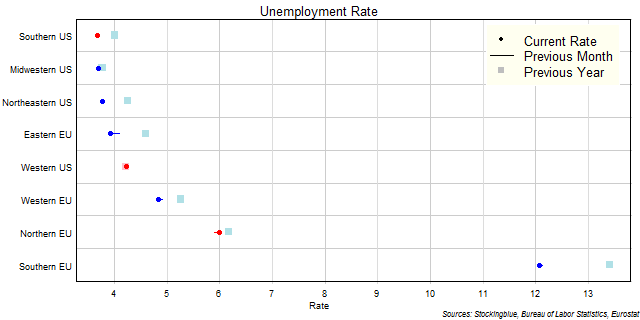
The chart above shows the unemployment rate in each EU and US region as of February 2019 (unless otherwise noted - see caveats below), the change from the previous month, and the rate one year prior. US regions fare considerably better in this metric than EU regions do.
US Regional Unemployment Rates, February 2019

The chart above shows the unemployment rate in each US region as of February 2019, the change from the previous month, and the rate one year prior. The South continues to hold the lowest unemployment rate as it did last month but was the rate that showed the greatest deterioration over the previous month.
OlderNewer