EU and US Regions by Miles of Subway Track
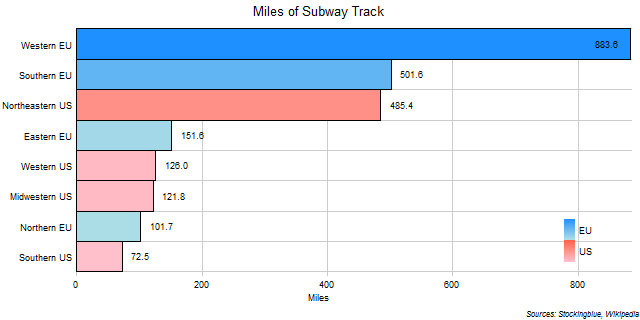
The chart above shows the miles of heavy rail subway track within each EU and US region. The Western EU has more miles of track than the entire US combined.
EU Regions by Kilometers of Subway Track

The chart above shows the kilometers of heavy rail subway track within each EU region. The Western EU has more kilometers of subway track than all other regions combined.
US Regions by Miles of Subway Track

The chart above shows the miles of heavy rail subway track within each US region. The Northeast has more miles of subway track than all other regions combined.
EU and US States by Length of Subway Track
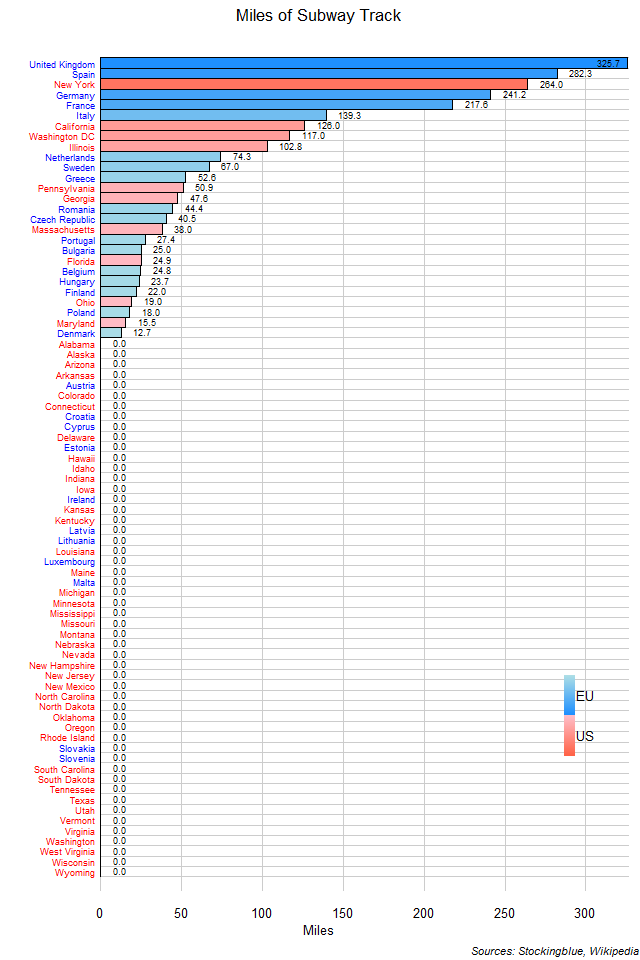
The chart above shows the miles of heavy rail subway track within each EU and US state. The EU dominates over the US in this metric. Not only do EU states have more track laid, but more EU states have subway systems than US states even though there are far more US states.
EU States by Length of Subway Track
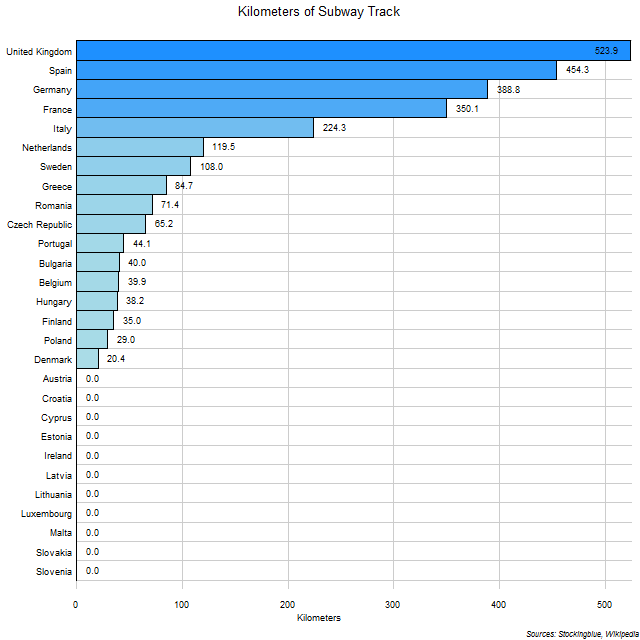
The chart above shows the kilometers of heavy rail subway track within each state. Over half the EU states have a heavy rail system.
US States by Miles of Subway Track
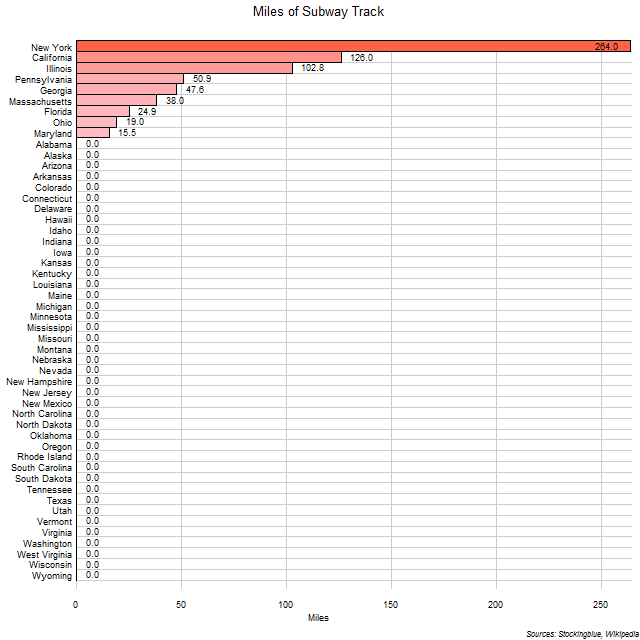
The chart above shows the miles of heavy rail subway track within each state. Only nine of the fifty states have subway systems; the District of Columbia also has a subway system but is not included in the list as it is not a state.
Unemployment Ratios in EU and US Regions, December 2018
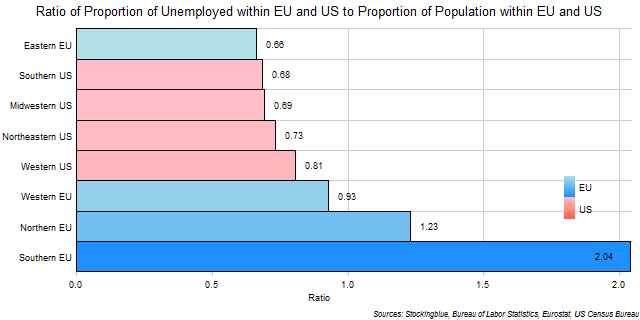
The chart above shows the ratio of the region's proportion of unemployed people in the EU and US to the region's proportion of total people in the EU and US. The Southern EU's unemployed population as a share of the total unemployed population in the EU and the US is twice as large as its total population's share of the total population in the EU and the US.
Unemployment Ratios in EU Regions, December 2018

The chart above shows the ratio of the region's proportion of unemployed people in the EU to the region's proportion of total people in the EU. The Southern EU makes up a disproportionate amount of the Union's unemployed.
Unemployment Ratios in US Regions, December 2018

The chart above shows the ratio of the region's proportion of unemployed people in the US to the region's proportion of total people in the US. Ratios are relatively even across all US regions.
EU and US Regional Unemployment Rates, December 2018
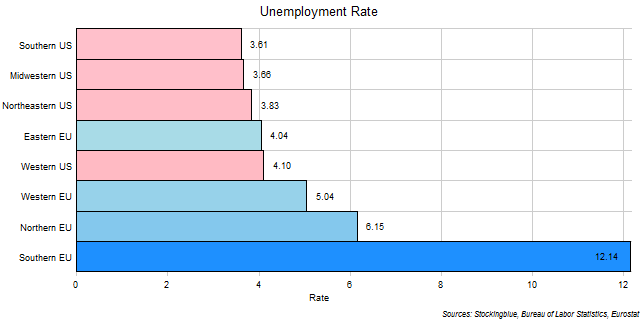
The chart above shows the unemployment rate in each EU and US region as of December 2018. The Southern EU has nearly double the unemployment rate of the next region.
OlderNewer