Air Travelers per Area in US Regions

The chart above shows the number of passengers that traveled by air for every square mile in each US region. The Northeast has almost twice as many air passengers per square mile than the next leading region.
Air Travelers per Area in EU Regions

The chart above shows the number of passengers that traveled by air for every square kilometer in each EU region. The Eastern EU almost finally got a break and didn't finish last in one of these metrics but the Northern EU just barely squeaked by it.
Air Travelers per Area in EU and US States
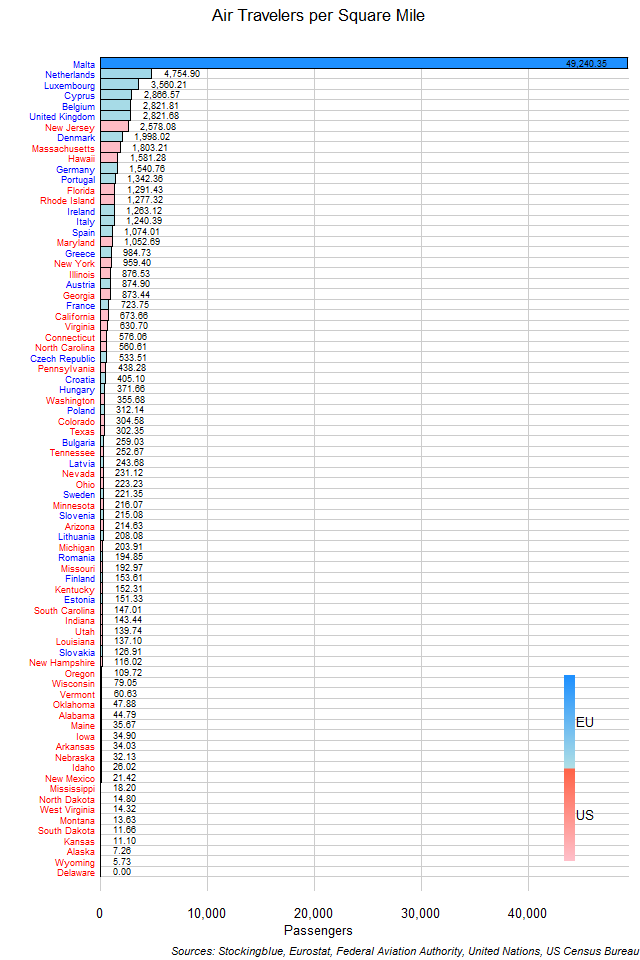
The chart above shows the number of passengers that traveled by air for every square mile in each EU and US state. No state in the EU or the US comes anywhere near the number of air passengers per square mile that Malta has.
Air Travelers per Area in US States
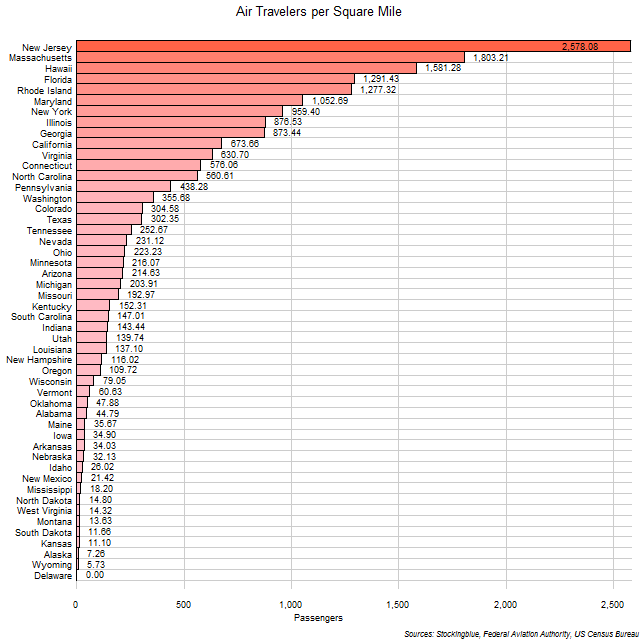
The chart above shows the number of passengers that traveled by air for every square mile in each US state. New Jersey has a huge lead over every other state.
Air Travelers per Area in EU States
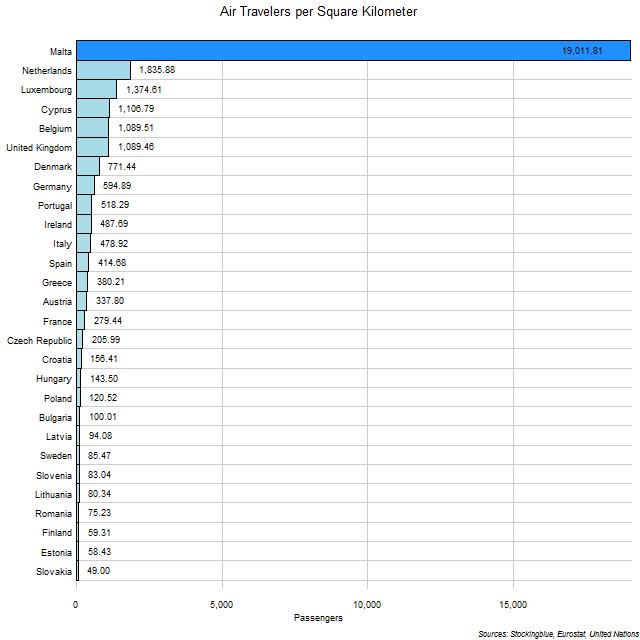
The chart above shows the number of passengers that traveled by air for every square kilometer in each EU state. Malta is in a class by itself.
Net Worth of Billionaires per Square Mile in EU and US Regions in 2018
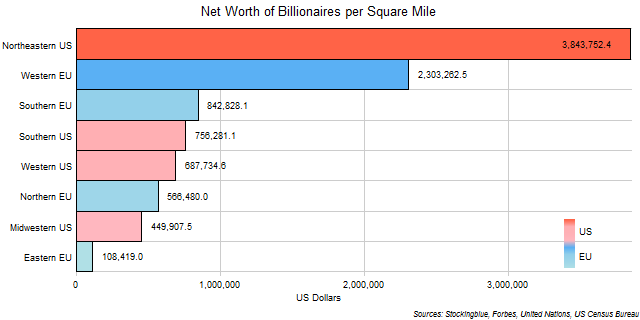
The chart above shows the net worth of the billionaires of each region per square mile. The Northeastern US and the Western EU are the only regions whose billionaires have a net worth per square mile of over $1 million.
Net Worth of Billionaires per Square Mile in US Regions in 2018

The chart above shows the net worth of the billionaires of each region per square mile. The Northeast is in a class by itself.
Net Worth of Billionaires per Square Kilometer in EU Regions in 2018

The chart above shows the net worth of the billionaires of each region per square kilometer. The Western EU leads all other regions by a huge margin.
Net Worth of Billionaires per Square Mile in EU and US States in 2018
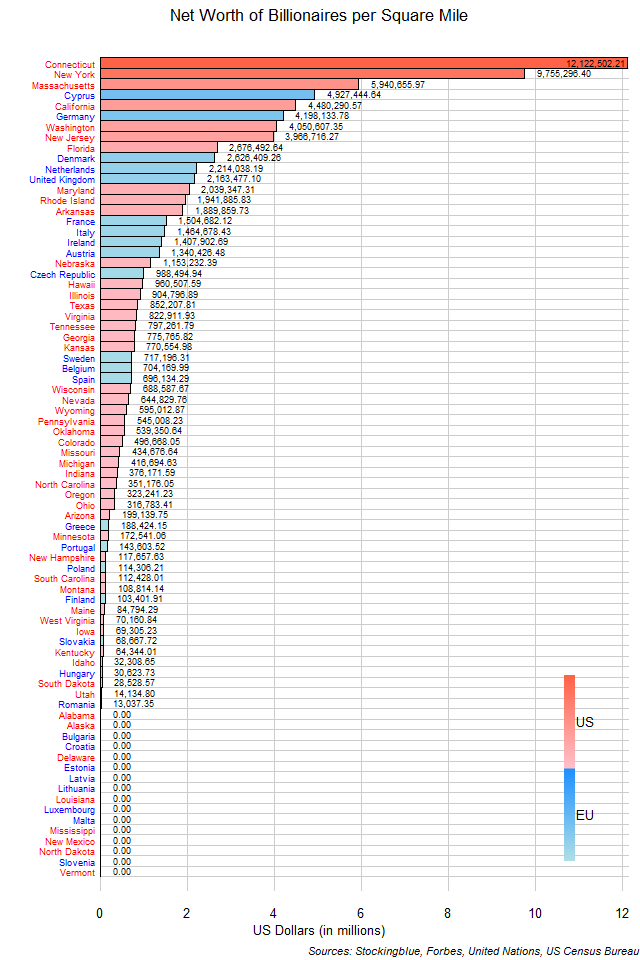
The chart above shows the net worth of the billionaires of each state per square mile. The top three states are all from the US as are four out of the top five and seven out of the top ten.
Net Worth of Billionaires per Square Mile in US States in 2018
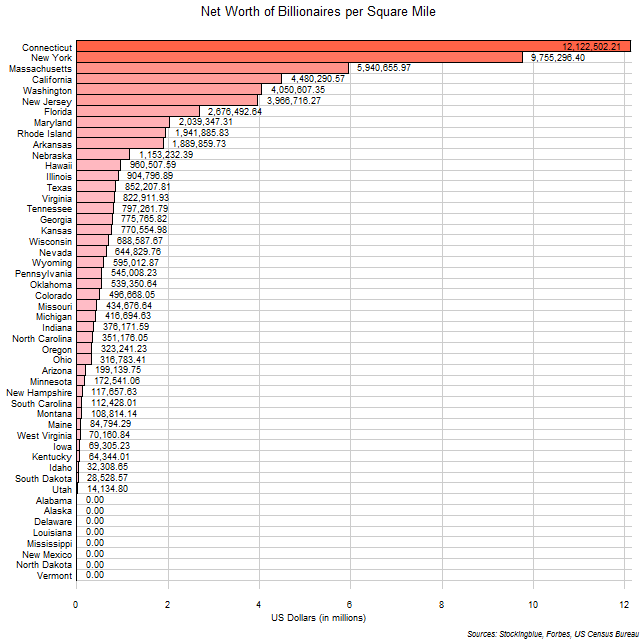
The chart above shows the net worth of the billionaires of each state per square mile. Connecticut and New York are in a class all their own.
OlderNewer