A Look Back at Treasuries in 2018
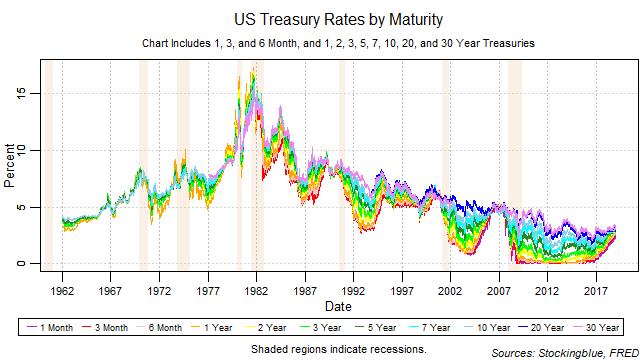
Short-term rates continued their dramatic turn upwards after being stuck at zero for several years while long-term rates made steady advances as well. The yield curve continued to narrow and it also narrowed from the bottom up. A narrowing from the short-term is a warning sign for an inversion that indicates recession.
Treasury Rate Movements, December 2018
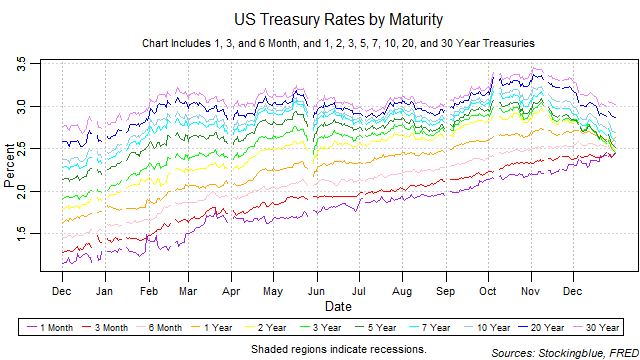
The one, three, and six-month rates rose in December while all other rates dropped. The yield curve narrowed from the previous month thus extending its narrowing streak to two months. The one-month bill did not maintain the lowest rate throughout the month. Long-term rates fell while short-term rates rose thus increasing the risk of an inversion brought upon by rising short-term rates. Such an inversion, if it were to happen would be a strong indicator for an upcoming recession.
Net Worth of Billionaires for Every Resident in EU and US States in 2018
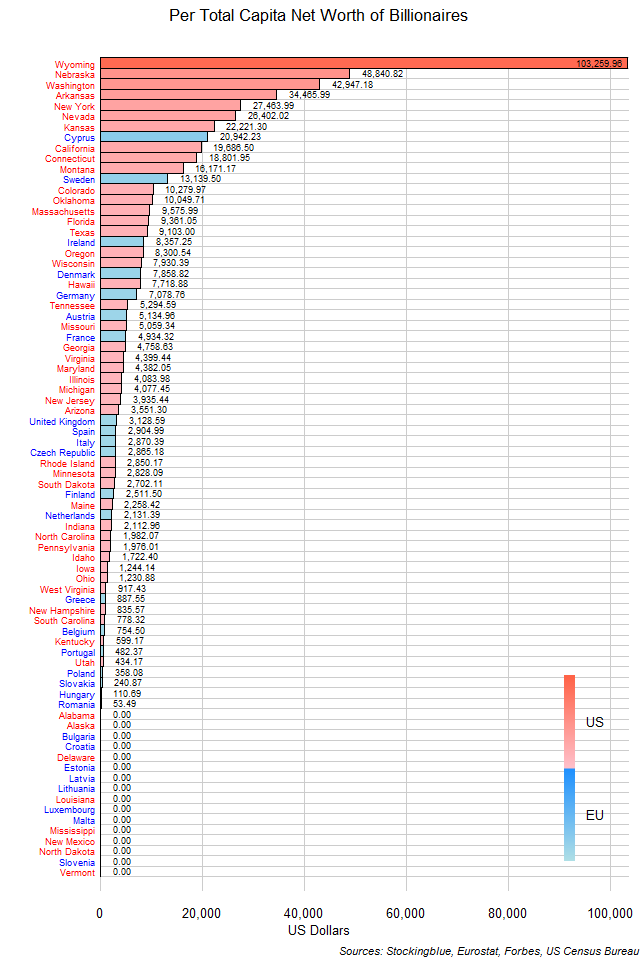
The chart above shows the net worth of the billionaires of each state divided by the population of said state. Wyoming has more than double per capita net worth of billionaires of the next leading state.
Net Worth of Billionaires for Every Resident in US States in 2018
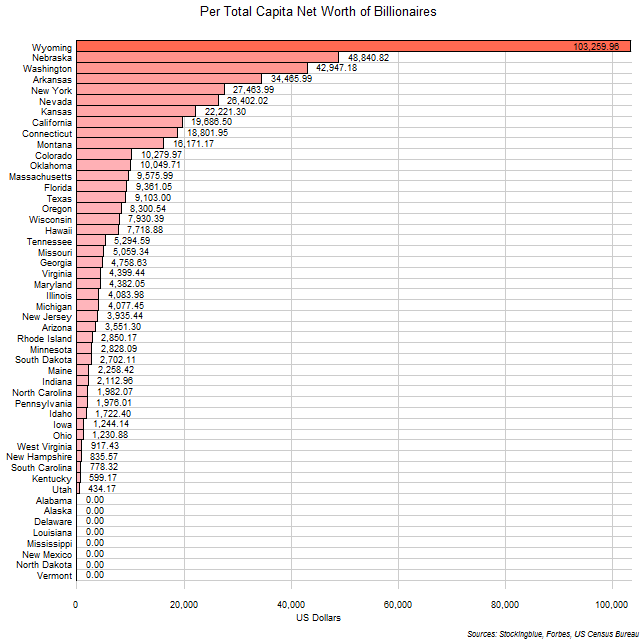
The chart above shows the net worth of the billionaires of each state divided by the population of said state. Wyoming has a commanding lead in this metric.
Net Worth of Billionaires for Every Resident in EU States in 2018
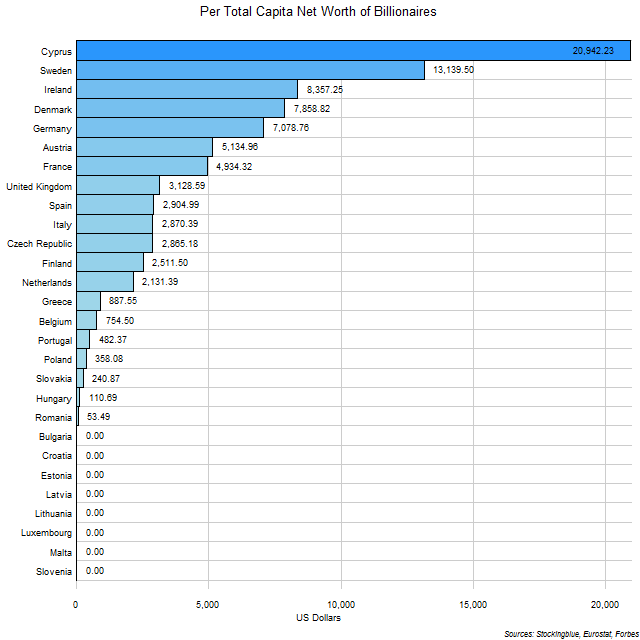
The chart above shows the net worth of the billionaires of each state divided by the population of said state. Although the net worth of Cypriot billionaires is relatively small, the really small population of the state helps to rank it first in this metric by a large margin.
Per Capita Air Travel in EU and US Regions
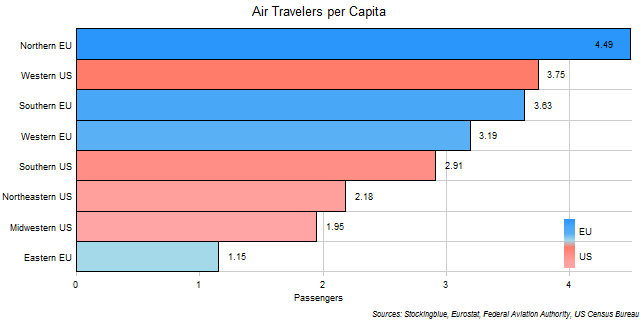
The chart above shows the number of passengers that traveled by air for every resident in each EU and US region. The Northern EU is the only region in both superstates to have more than four air travelers for every resident in the region.
Per Capita Air Travel in US Regions

The chart above shows the number of passengers that traveled by air for every resident in each US region. The West is the region with the most air passengers per capita in the US.
Per Capita Air Travel in EU Regions

The chart above shows the number of passengers that traveled by air for every resident in each EU region. The Northern EU is the region with the most air passengers per capita in the EU.
Air Travel in EU and US Regions
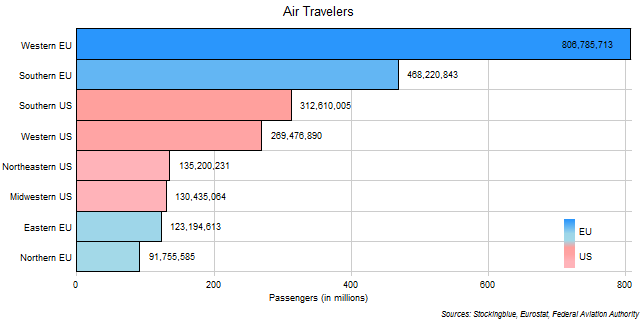
The chart above shows the number of passengers that traveled by air in each EU and US region. The Western EU has so many air travelers that it has more than the next two regions combined.
Where Do European Christmas Trees Come From?
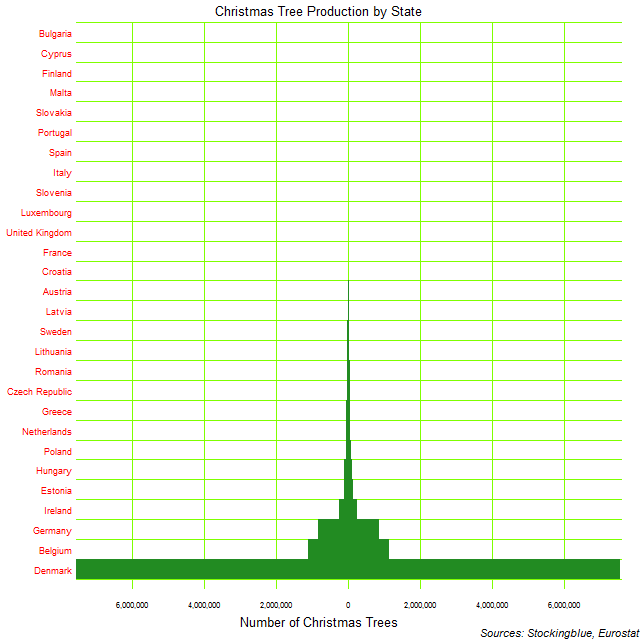
The chart above shows the number of Christmas trees produced by each state. Unfortunately, Christmas tree production in the EU is very skewed and thus the chart does not look like a tree. Oh well, it's the thought that counts. Denmark seems to be the Christmas tree behemoth in the EU.
OlderNewer