GDP and Change in GDP in EU and US Regions between 2008 and 2017
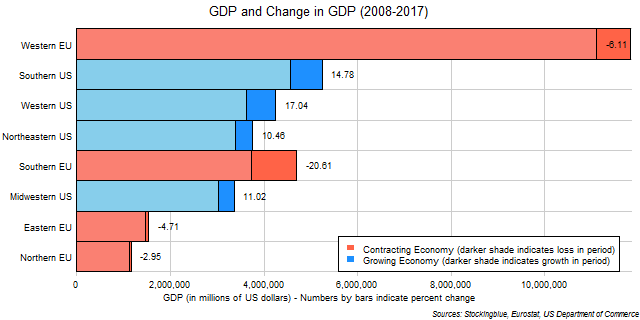
The chart above shows the GDP and change in GDP over the last ten years in EU and US regions in US dollars. All four US regions grew in the past ten years while all four EU regions shrank in the past ten years (when priced in US dollars).
GDP and Change in GDP in EU Regions between 2008 and 2017

The chart above shows the GDP and change in GDP over the last ten years in EU regions in euros. All four regions grew in the past ten years however, the Southern EU had a considerably small relative growth rate than the other three regions.
GDP and Change in GDP in US Regions between 2008 and 2017

The chart above shows the GDP and change in GDP over the last ten years in US regions in US dollars. All four regions grew in the past ten years and their growth rates were pretty similar.
GDP and Change in GDP in EU and US States between 2008 and 2017
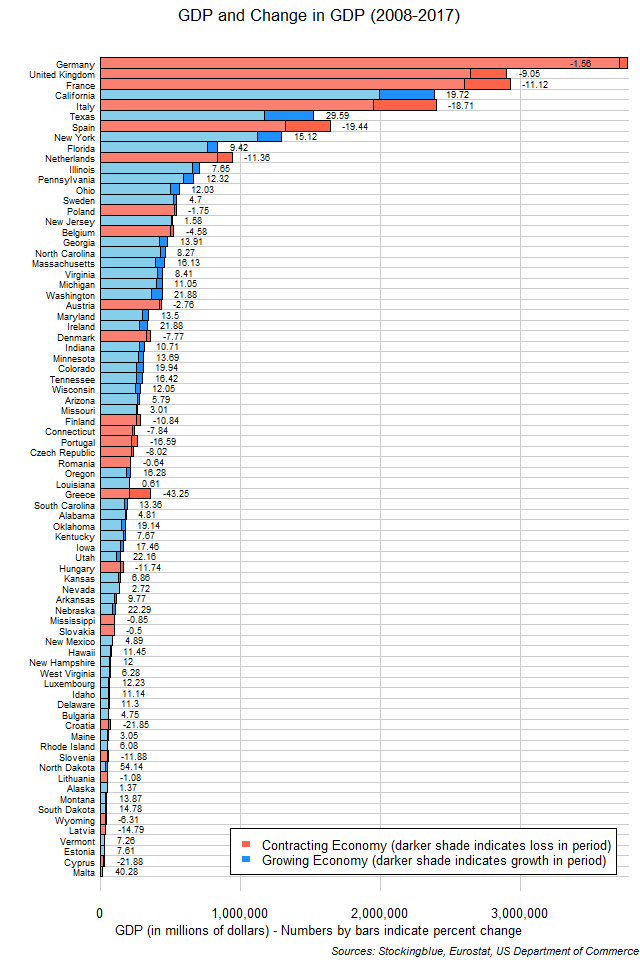
The chart above shows the GDP and change in GDP over the last ten years in EU and US states in US dollars. Although the three largest economies all shrank in the ten year period, they managed to remain the three largest economies, even though the second and third largest economies swapped places.
GDP and Change in GDP in US States between 2008 and 2017
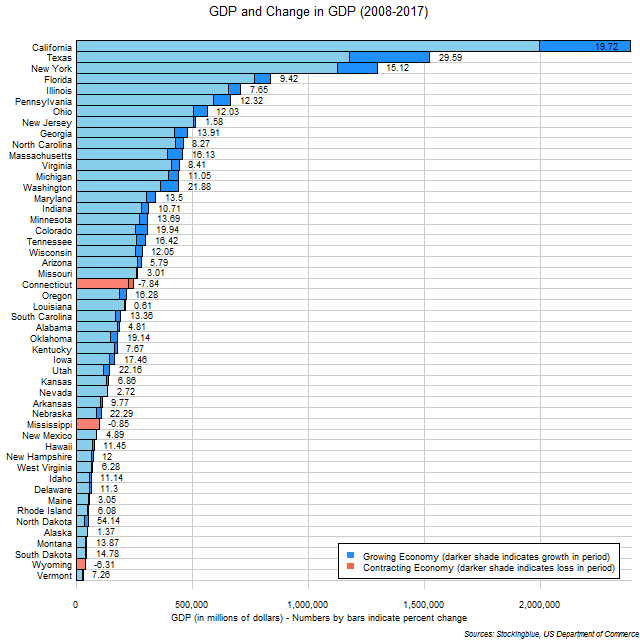
The chart above shows the GDP and change in GDP over the last ten years in US states. The Californian economy grew by more in the past ten years than the entire economy of 36 US states.
GDP and Change in GDP in EU States between 2008 and 2017
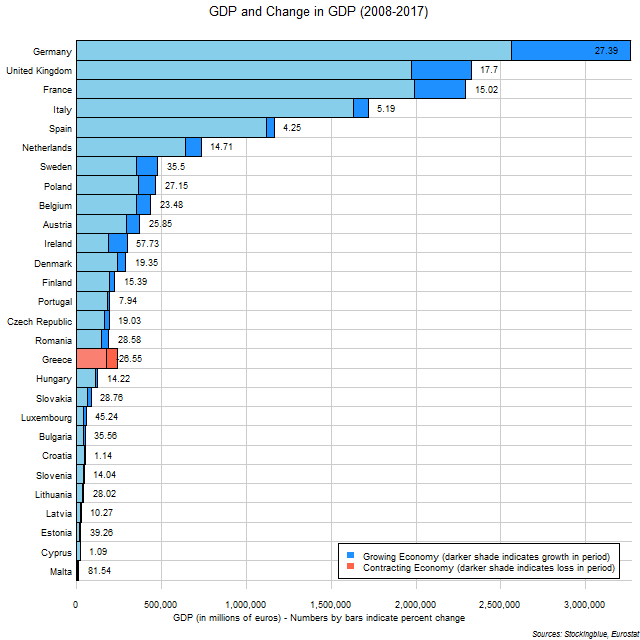
The chart above shows the GDP and change in GDP over the last ten years in EU states. The German economy grew by more in the past ten years than the entire economy of 22 EU states.
Treasury Rate Movements, June 2018
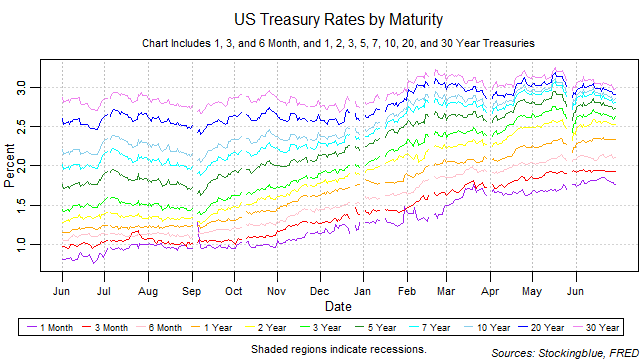
The 30-year rate was the only one to drop in June while the three-month and the 20-year rates remained steady and all other rates rose. The yield curve narrowed from the previous month and extended its narrowing streak to two-months. The one-month bill maintained the lowest rate throughout the month. Although short-term rates rose, they did not rise as rapidly as the 30-year dropped and thus the yield curve narrowed mostly from the top decreasing the risk of an inversion brought upon by rising short-term rates. Such an inversion, if it were to happen would be a strong indicator for an upcoming recession.
Economic Growth and Contraction in EU and US Regions between 2016 and 2017
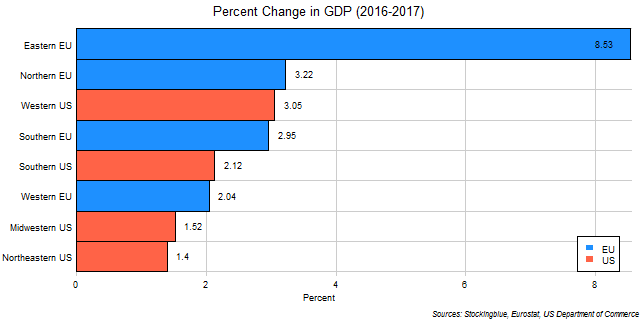
The chart above shows change in GDP over the last year in EU and US regions. The Eastern EU was the fastest growing region in both the EU and the US by far.
Economic Growth and Contraction in EU Regions between 2016 and 2017

The chart above shows change in GDP over the last year in EU regions. The Eastern EU grew by more than twice as much as the second fastest growing region last year.
Economic Growth and Contraction in US Regions between 2016 and 2017

The chart above shows change in GDP over the last year in US regions. The Western US was, by far, the fastest growing region last year.
OlderNewer