Waterway Coverage in US States
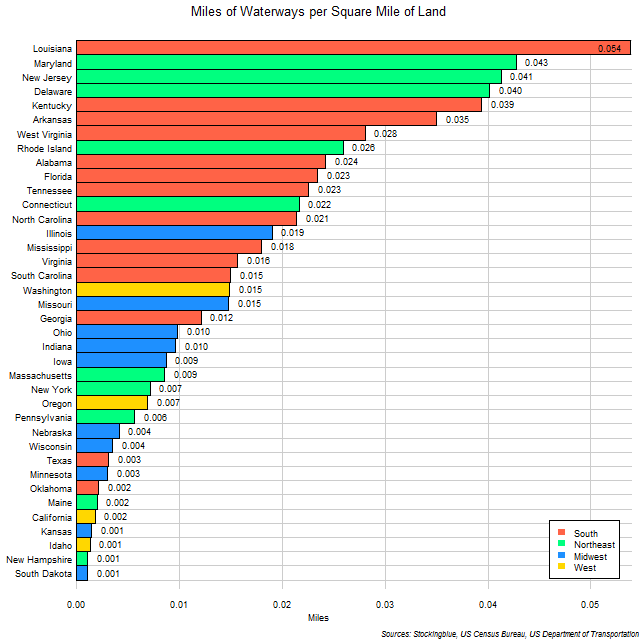
The chart above shows the miles of waterways per square mile of land in US states. Louisiana has the greatest waterway to land ratio of any US state.
Waterways in EU and US Regions
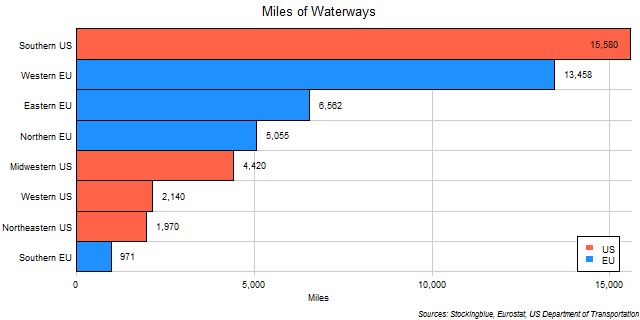
The chart above shows the length of waterways in EU and US regions. The Southern US has the most waterways but it is followed by three EU regions.
Waterways in US Regions

The chart above shows the length of waterways in US regions. The South has more waterways than the other three regions combined and almost as many as the other three regions doubled.
Waterways in EU Regions

The chart above shows the length of waterways in EU regions. The Western EU has more waterways than the other three regions combined.
Treasury Rate Movements, May 2018
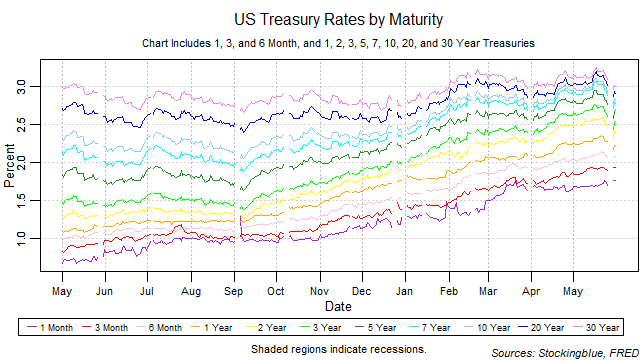
Short-term rates rose in May while medium and long-term rates dropped. The yield curve narrowed from the previous month and broke its one-month widening streak. The one-month bill maintained the lowest rate throughout the month. As the one-month rate had the largest increase in both absolute and relative terms, the yield curve narrowed from the bottom increasing the risk of an inversion brought upon by rising short-term rates. Such an inversion, if it were to happen would be a strong indicator for an upcoming recession.
Waterways in EU and US States
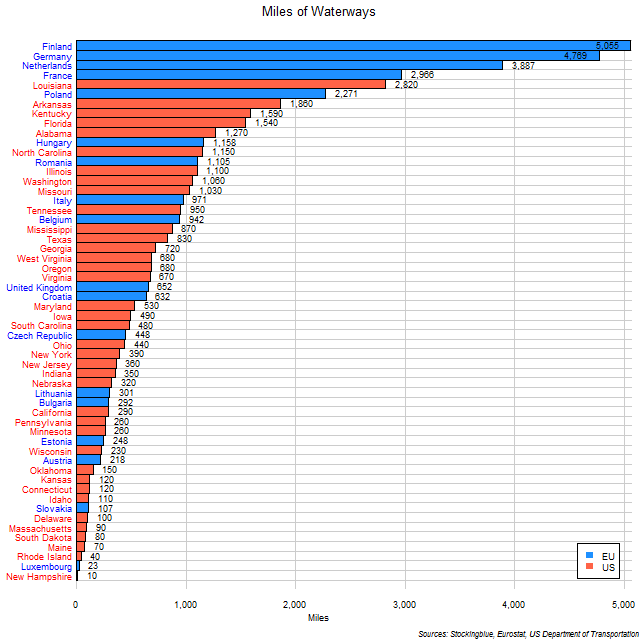
The chart above shows the length of waterways in EU and US states. Finland not only tops the chart but accounts for one-tenth of the total waterways in the EU and the US.
Waterways in EU States
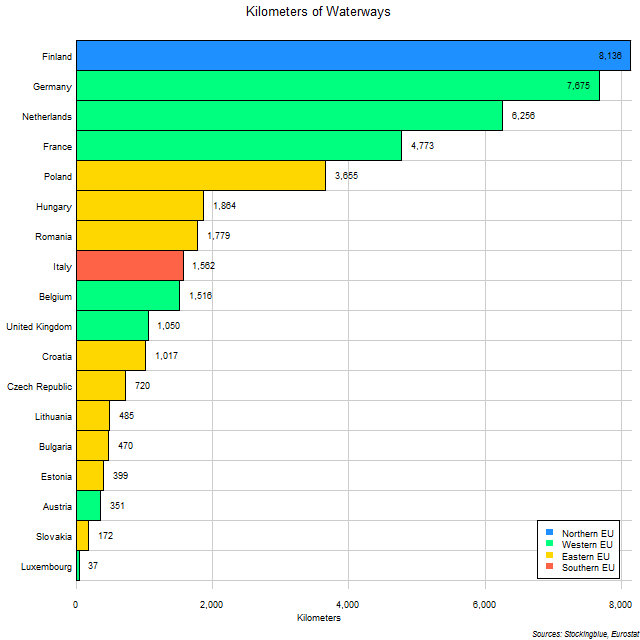
The chart above shows the length of waterways in EU states. Finland may have the longest inland waterways but it is followed by several states from the Western EU.
Waterways in US States
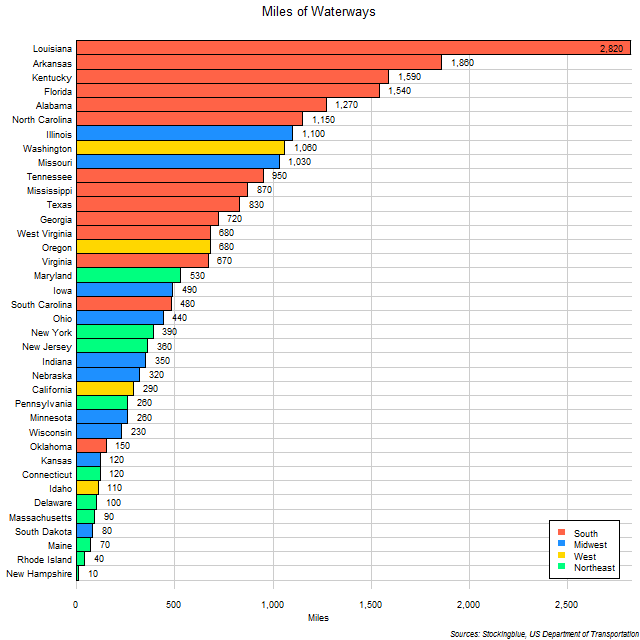
The chart above shows the length of waterways in US states. Louisiana has by far the most waterways in the nation and the South in general leads the other regions.
Per Capita Rail Coverage in EU and US Regions
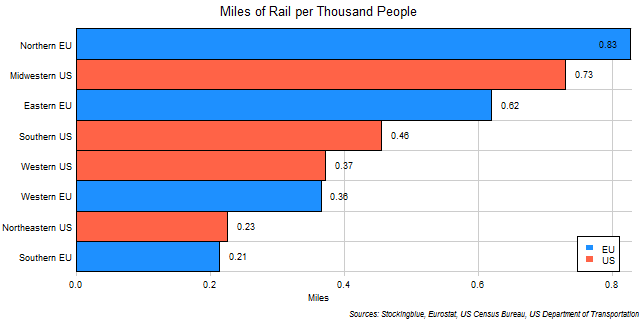
The chart above shows miles of rail per thousand people in EU and US regions. It's rare to see the EU and US regions be so similar to each other. Usually, the regions of one superstate clump together but in this metric there is a weaving back and forth between EU and US regions.
Per Capita Rail Coverage in US Regions

The chart above shows miles of rail per thousand people in US regions. The Midwest has more track per capita than any other region and has double the per capita track of every region except the South.
OlderNewer