The Arabian Peninsula's Borders Based on Per Capita GDP
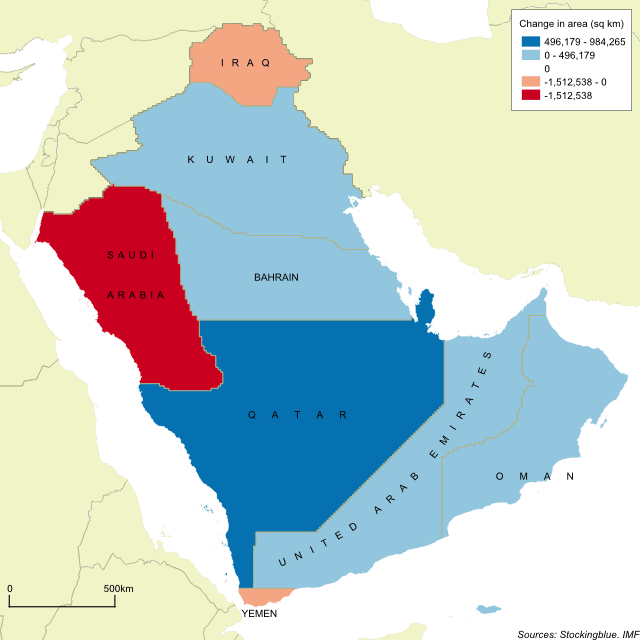
The geographically accurate cartogram above represents the borders of the nations in the region based on their per capita GDP. Qatar becomes the largest state in the region by far and is nearly double the size of the second largest state.
The Arabian Peninsula's Borders Based on Population
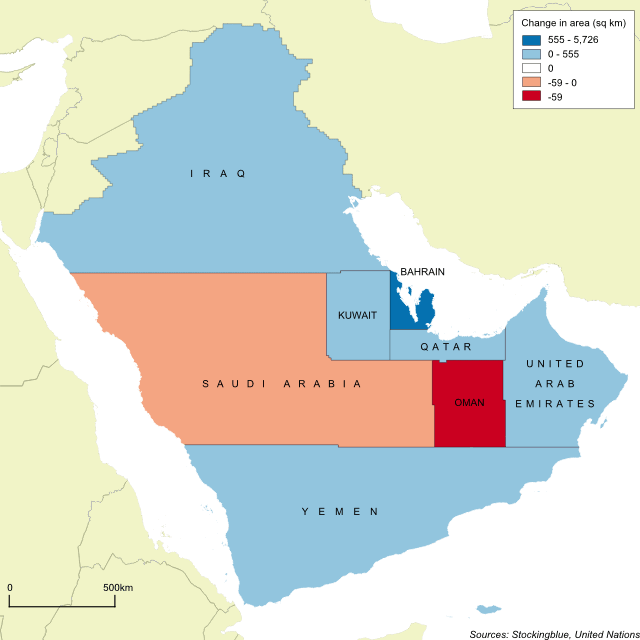
The geographically accurate cartogram above represents the borders of the nations in the region based on their population. Iraq becomes the largest country with Saudi Arabia a close second.
The Arabian Peninsula's Borders Based on Military Personnel
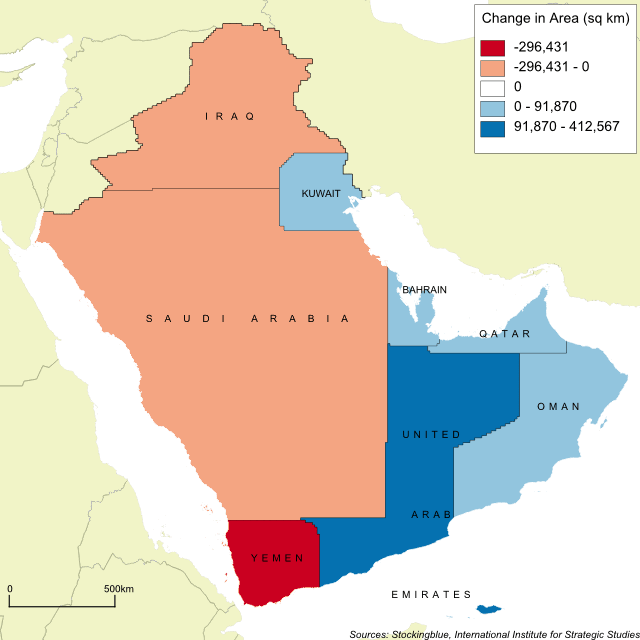
The geographically accurate cartogram above represents the borders of the nations in the region based on the number of active military personnel. Once again, the kingdom of Saudi Arabia dominates its neighbors.
The Arabian Peninsula's Borders Based on Oil Production
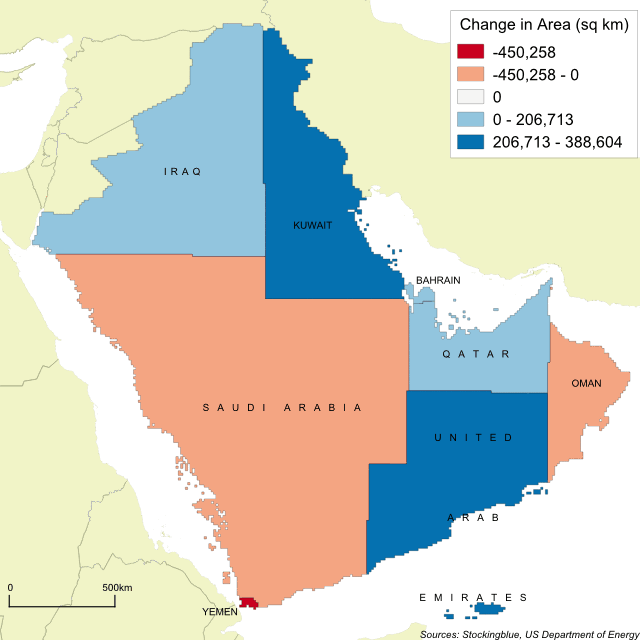
The geographically accurate cartogram above represents the borders of the nations in the region based on oil production. Surprisingly, Saudi Arabia shrinks in size, however, it still remains the largest state in the region.
The Arabian Peninsula's Borders Based on Gross Domestic Product
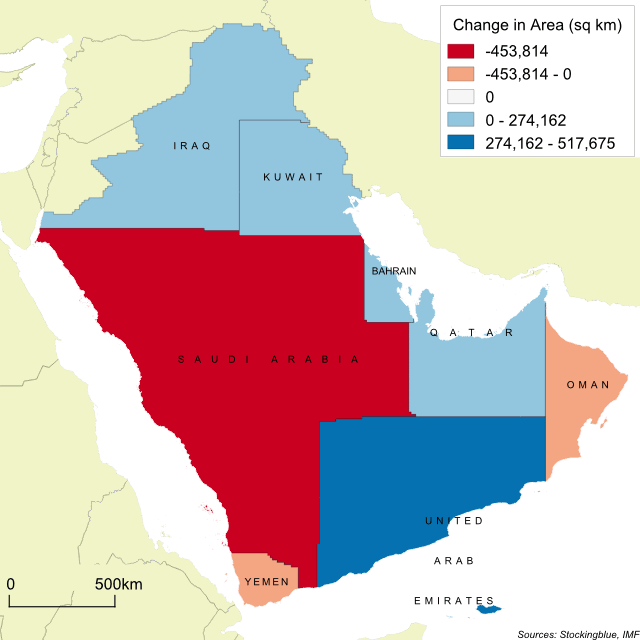
This week, the focus is on the Arabian Peninsula as recent events there are causing global concern. The geographically accurate cartogram above represents the nations in the region based on gross domestic product.
The European Union's Borders Based on Gross Domestic Product
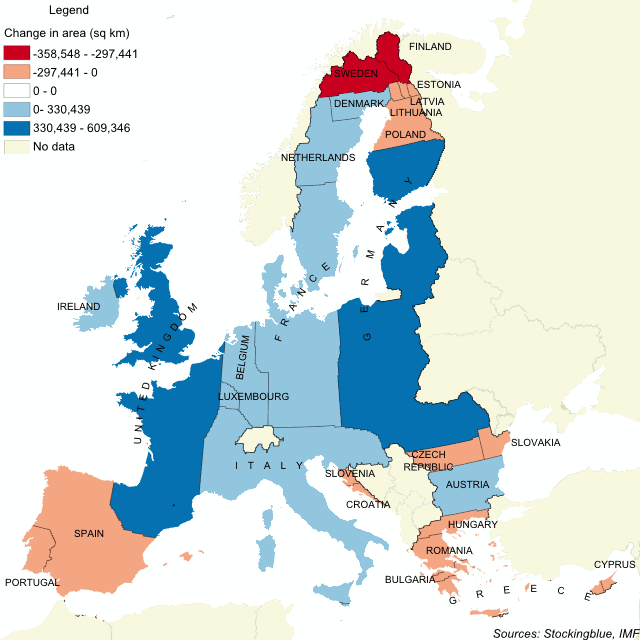
This geographically accurate cartogram represents how the EU's borders would have been had they been drawn up according to each country's GDP. The United Kingdom, France, Germany, and Italy take up large swaths of the Union leaving the remaining states crunched up against each other.
The European Union's Borders by Military Personnel
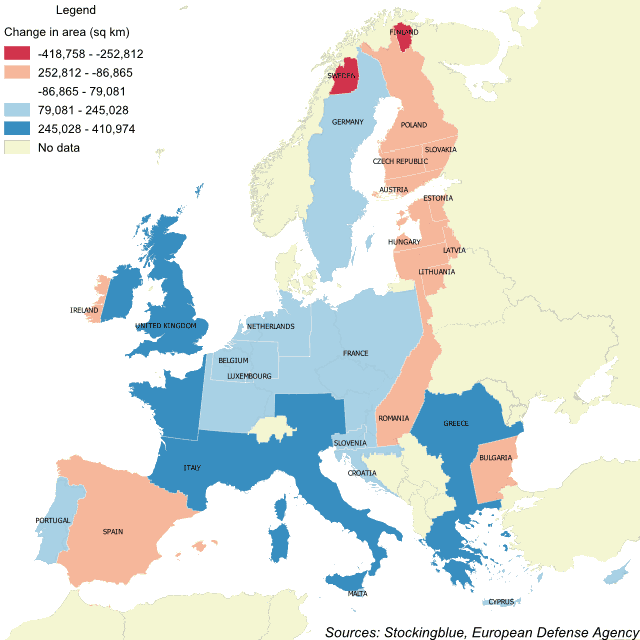
Altering the borders of the European Union based on the number of military personnel each state has creates an unrecognizable European Union. In this geographically accurate cartogram, the United Kingdom, Italy, and Greece expand their borders drastically while Sweden and Finland cede much of their territory.
Newer