EU and US Cities by Population of Urban Area
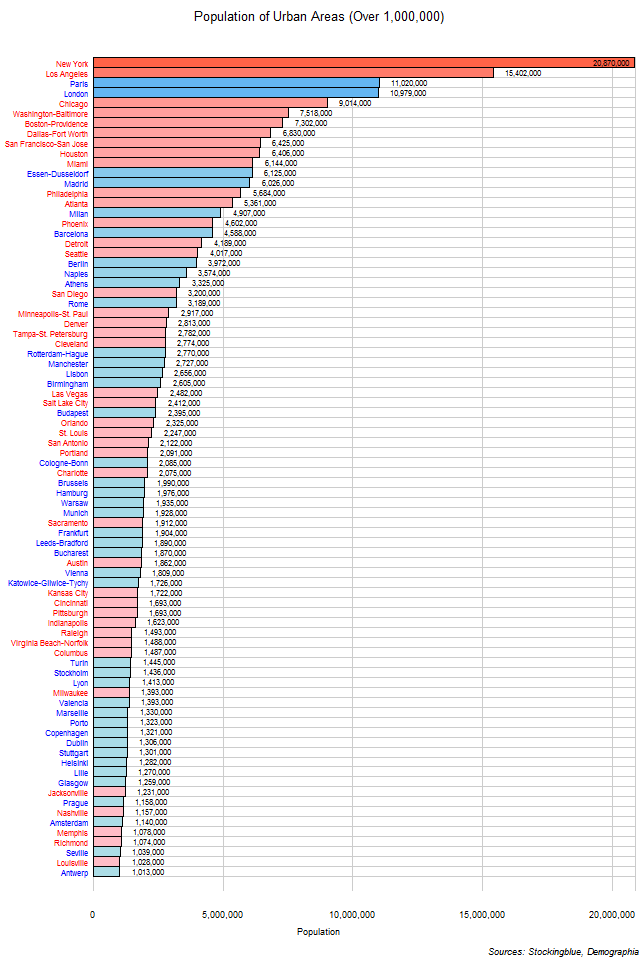
The chart above shows the population of each urban area with a population over 1,000,000 while the chart below shows all urban areas with a population between 500,000 and 1,000,000. The urban areas have been normalized so as to avoid any inconsistencies with how cities and their metropolitan areas are defined by their governments. Each urban area has similar characteristics making this the definitive method with which to compare cities across various countries. New York and Los Angeles are by far the two largest cities.
US Cities by Population of Urban Area
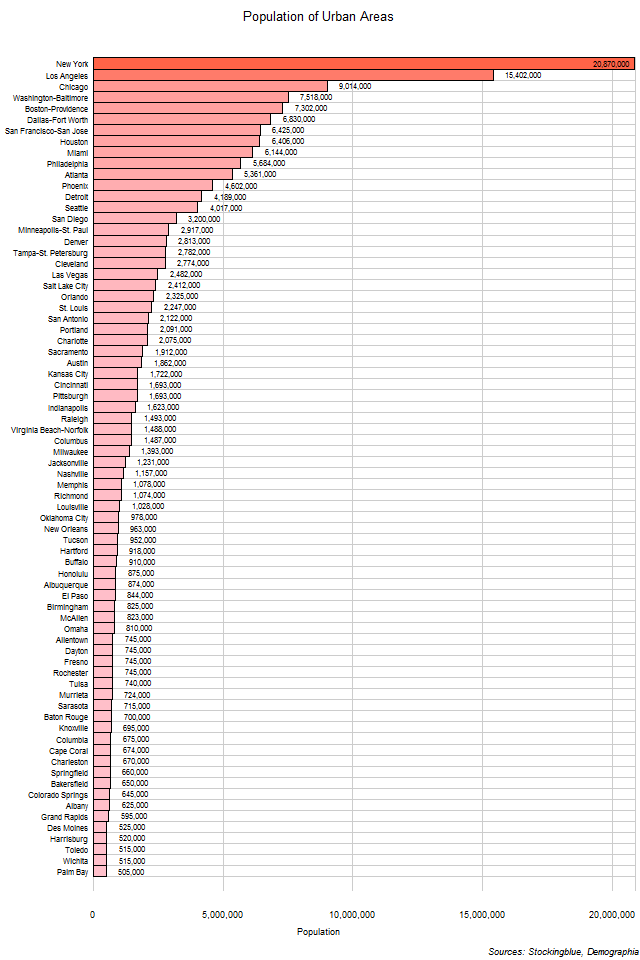
The chart above shows the population of each urban area with a population over 500,000. The urban areas have been normalized so as to avoid any inconsistencies with how cities and their metropolitan areas are defined by their governments. Each urban area has similar characteristics making this the definitive method with which to compare cities across various countries. New York has the largest population in the US.
EU Cities by Population of Urban Area
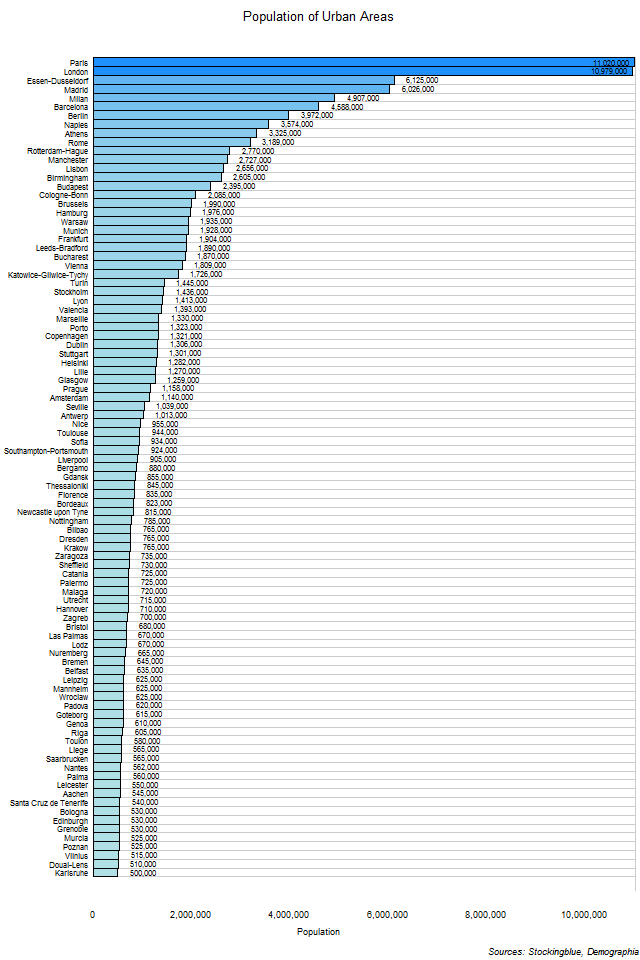
The chart above shows the population of each urban area with a population over 500,000. The urban areas have been normalized so as to avoid any inconsistencies with how cities and their metropolitan areas are defined by their governments. Each urban area has similar characteristics making this the definitive method with which to compare cities across various countries. Paris has the largest population in the EU.
Long-Term EU and US GDP Growth Rate by Region, First Quarter 2021
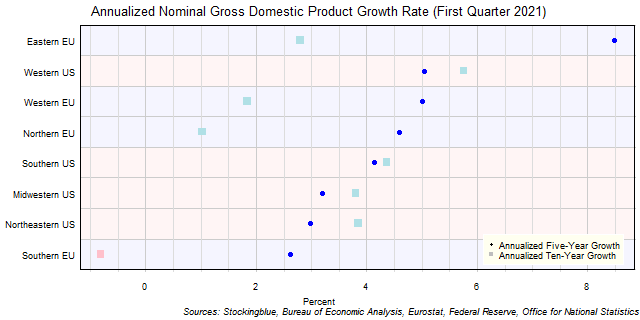
The chart above shows the annualized nominal gross domestic product (GDP) growth rate when priced in US dollars in each EU and US region over the past five years as of the first quarter of 2021 and the growth over the past ten years. The Southern EU was the only region that did not experience growth over the past ten years.
Long-Term EU GDP Growth Rate by Region, First Quarter 2021

The chart above shows the annualized nominal gross domestic product (GDP) growth rate in each EU region over the past five years as of the first quarter of 2021 and the growth rate over the past ten years. All four regions grew over both time periods.
Long-Term US GDP Growth Rate by Region, First Quarter 2021

The chart above shows the annualized nominal gross domestic product (GDP) growth rate in each US region over the past five years as of the first quarter of 2021 and the growth rate over the past ten years. All four regions grew over both time periods.
Long-Term EU and US GDP Growth Rate by State, First Quarter 2021
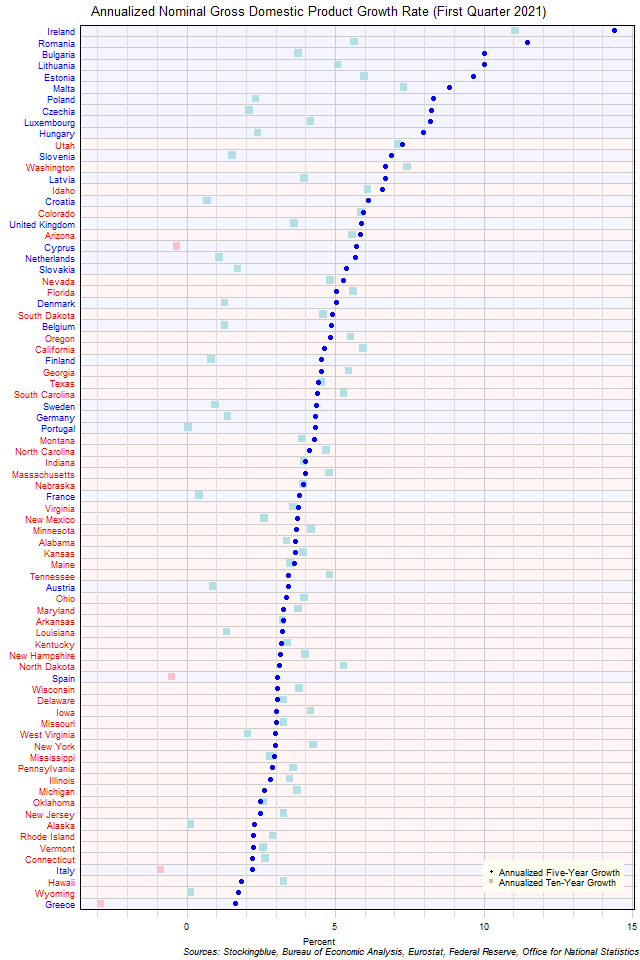
The chart above shows the annualized nominal gross domestic product (GDP) growth rate when the GDP is priced in US dollars in each EU and US state over the past five years as of the first quarter of 2021 and the growth rate over the past ten years. Four states had negative growth over the past ten years while zero had negative growth over the past five.
Long-Term EU GDP Growth Rate by State, First Quarter 2021
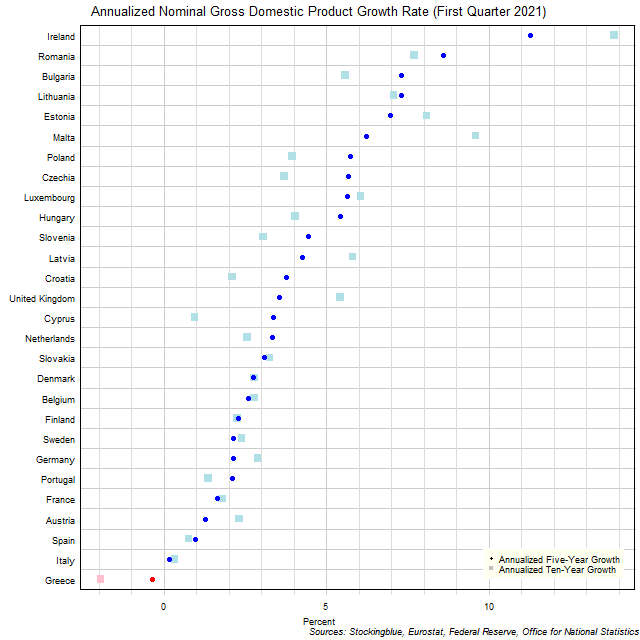
The chart above shows the annualized nominal gross domestic product (GDP) growth rate in each EU state over the past five years as of the first quarter of 2021 and the growth rate over the past ten years. One state experienced negative growth either in the past five years or in the past ten years.
Long-Term US GDP Growth Rate by State, First Quarter 2021
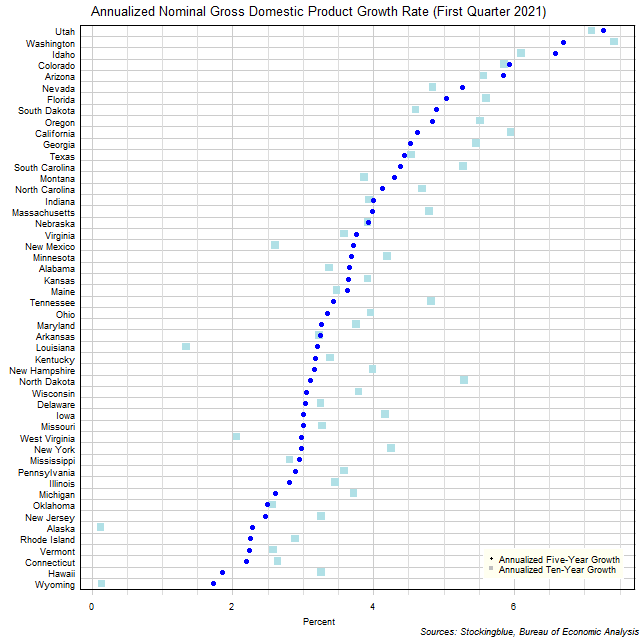
The chart above shows the annualized nominal gross domestic product (GDP) growth rate in each US state over the past five years as of the first quarter of 2021 and the growth rate over the past ten years. All states experienced growth both over the past five years and the past ten years.
Long-Term Per Capita GDP by EU and US Region, First Quarter 2021
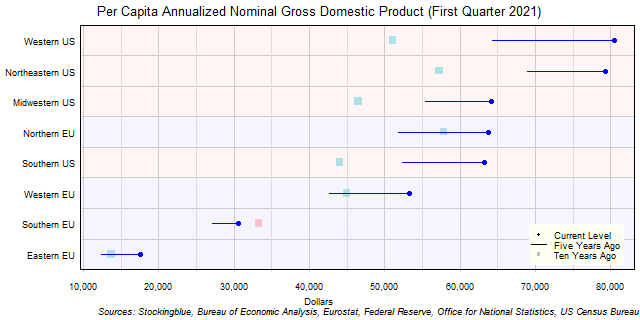
The chart above shows the per capita annualized nominal gross domestic product (GDP) in each EU and US region as of the first quarter of 2021 in US dollars, the change from five years ago, and the per capita GDP ten years prior. Only one EU region has seen a drop in per capita GDP over the past five or ten years.
OlderNewer