Per Capita International Tourists in US States in 2012
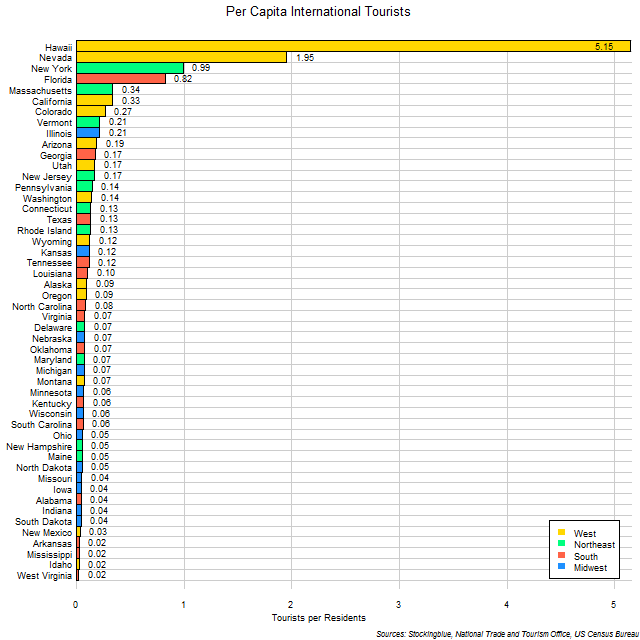
The chart above shows the number of tourists per resident that visited each US state in 2012. Hawaii receives over five times its population in international tourists per year and is by far the leader in this metric as no other state receives twice its population in international tourists.
Per Capita International Tourists in EU States in 2012
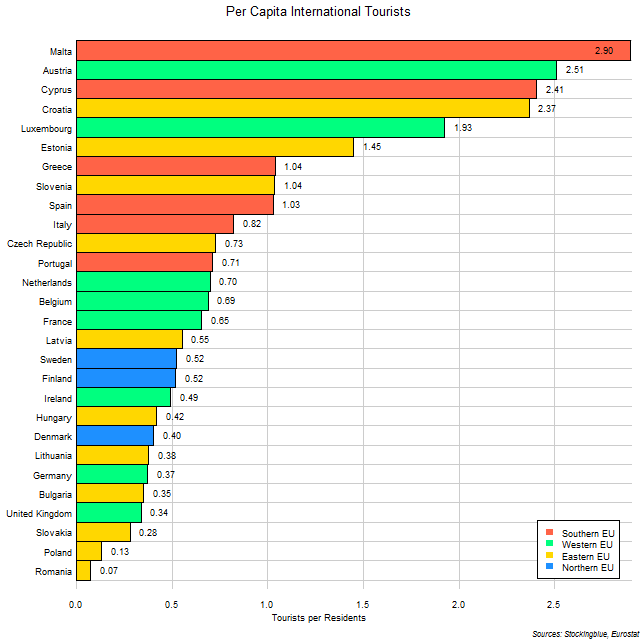
The chart above shows the number of tourists per resident that visited each EU state in 2012. Malta receives nearly three times its population in international tourists per year, although it does help to have a small population as the base figure. Of all the states that receive more than 1.5 times their population in tourists annually, only Austria has a sizable population to begin with.
International Tourists in EU and US States in 2012
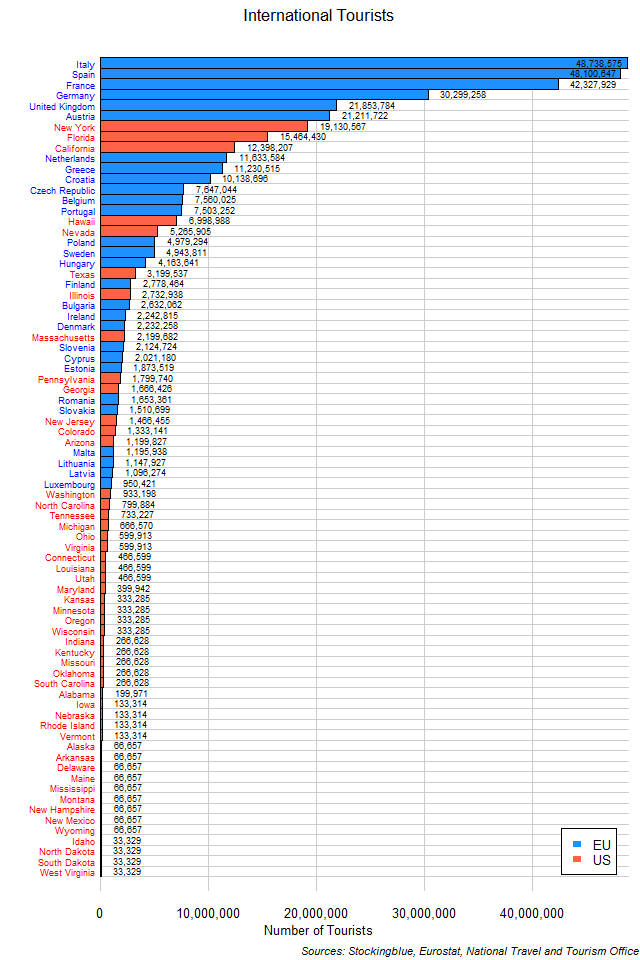
The chart above shows the number of tourists that visited each EU and US state in 2012. EU states account for seven of the top ten states in international tourists. Note however, that US data does not include domestic travelers from other US states whereas EU data does include travelers from other EU countries.
Tourists in US States in 2012
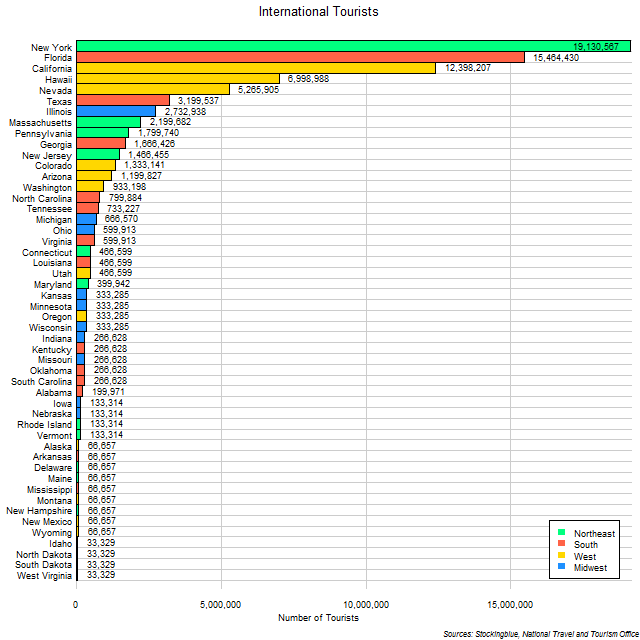
The chart above shows the number of tourists that visited each US state in 2012 based on survey data. Three states accounted for half of the international tourists in US states: New York, Florida, and California.
Tourists in EU States in 2012
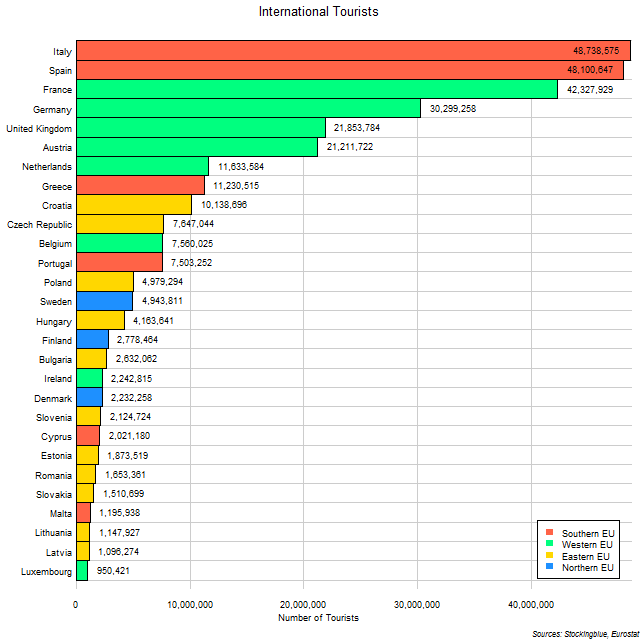
The chart above shows the number of tourists that visited each EU state for one night or more in 2012 (unless otherwise indicated). Four states accounted for half of the international tourists in EU states: Italy, Spain, France, and Germany.
Foreign Direct Investment in US States in 2017
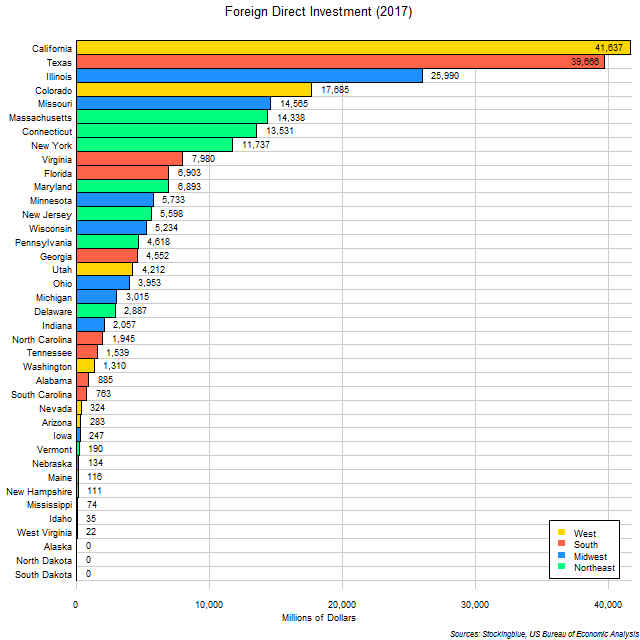
The chart above shows the foreign direct investment (FDI) in dollars for each US state in 2017. Five states accounted for half of the foreign inflows in the US: California, Texas, Illinois, Colorado, and Missouri.
Foreign Direct Investment in EU States in 2012
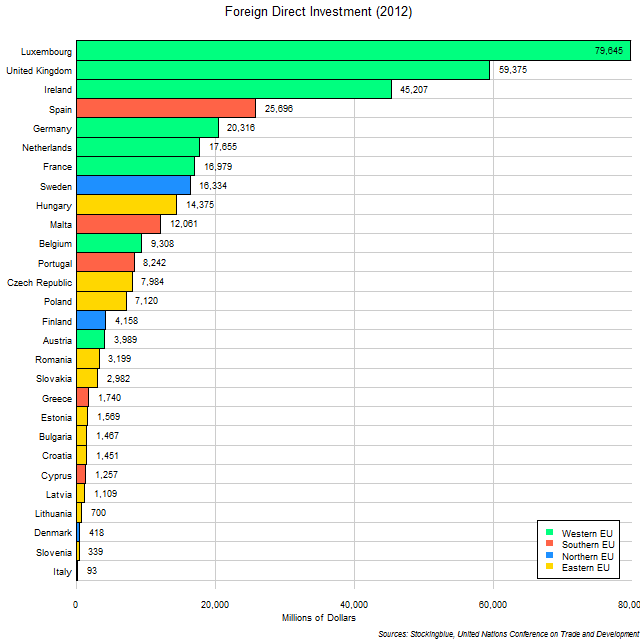
The chart above shows the foreign direct investment (FDI) in dollars for each EU state in 2012. Three states accounted for half of the foreign inflows in the EU: Luxembourg, the United Kingdom, and Ireland.
Residential Natural Gas Prices in EU and US Regions in 2016
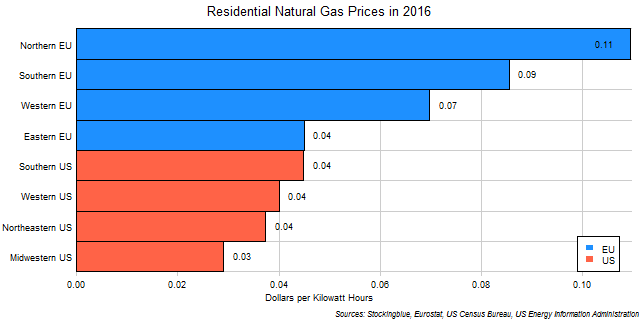
The chart above shows the residential cost of natural gas per kilowatt hour in US dollars for each EU and US region in 2016. Every single EU region has more costly residential natural gas than every single US region.
Residential Natural Gas Prices in EU Regions in 2016

The chart above shows the residential cost of natural gas per kilowatt hour for each EU region in 2016. The Northern EU which has the most need for the commodity has the highest prices for it.
Residential Natural Gas Prices in US Regions in 2016

The chart above shows the residential cost of natural gas per thousand cubic feet for each US region in 2016. The South, on average, has the most expensive residential natural gas. Luckily for the South, its residents need to heat their homes less than the other regions do.
OlderNewer