Residential Natural Gas Prices in EU and US States in 2016
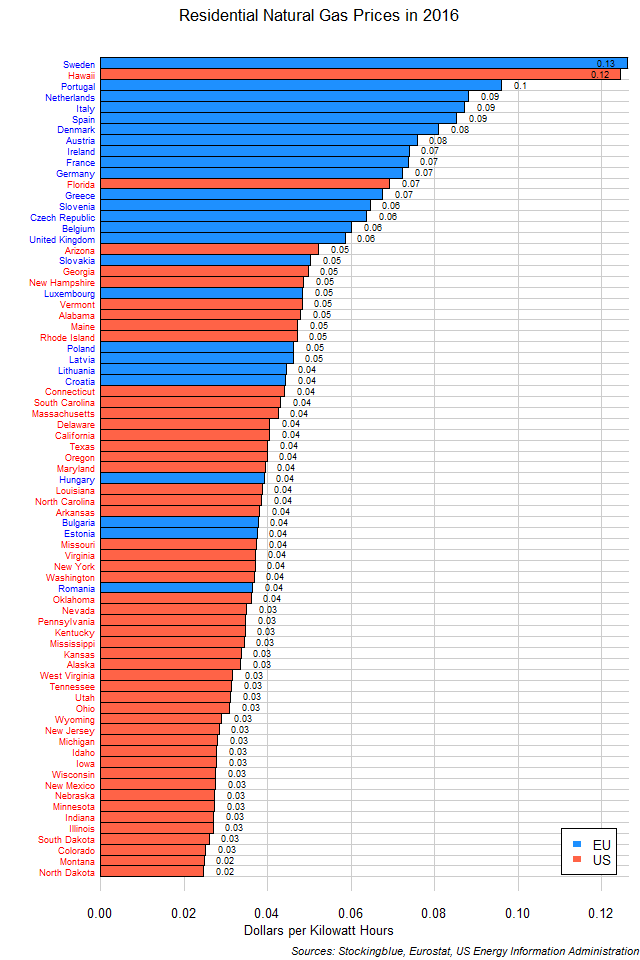
The chart above shows the residential cost of natural gas per kilowatt hour in US dollars for each EU and US state in 2016. Surprisingly, Sweden has higher costs than Hawaii which has serious shipping issues as it is located in the middle of the world's largest ocean.
Residential Natural Gas Prices in EU States in 2016
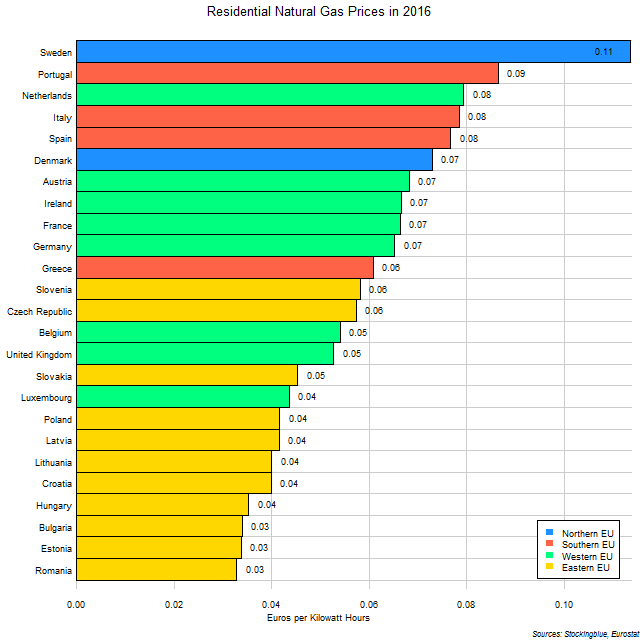
The chart above shows the residential cost of natural gas per kilowatt hour for each EU state in 2016. Sweden has the most expensive residential natural gas which is interesting seeing as it is a nation that probably needs home heating than most of the other states in the list.
Residential Natural Gas Prices in US States in 2016
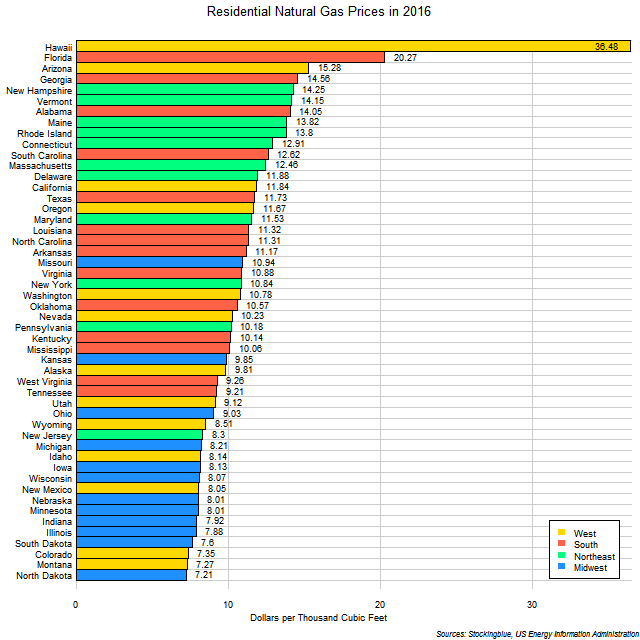
The chart above shows the residential cost of natural gas per thousand cubic feet for each state in 2016. Hawaii, which is located in the middle of the world's largest ocean, clearly has some issues with shipment of the commodity. That may be a large contributing factor as to why the cost of residential natural gas is nearly double the next most expensive state and more than double to five times more expensive than all other states.
EU and US Regions' Vacation Spending As Percent of Per Capita GDP in 2015
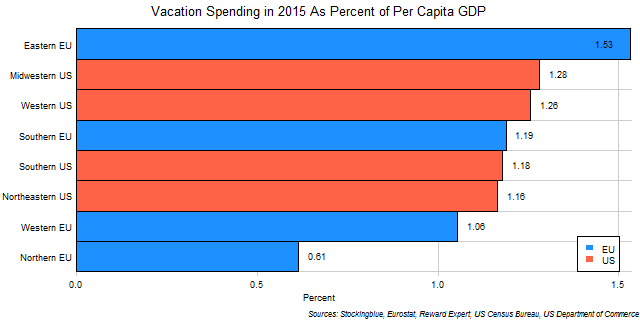
The chart above shows the average vacation expenditures for overnight stays by EU and US region as proportion of per capita GDP. There is a greater discrepancy in vacation spending between regions when per capita GDP is accounted for in the EU than there is in the US.
EU Regions' Vacation Spending As Percent of Per Capita GDP in 2015

The chart above shows the average vacation expenditures for overnight stays by EU region as proportion of per capita GDP. There is quite a disparity on vacation spending in EU regions with the Eastern EU spending more than twice as much of per capita GDP on vacations than the Northern EU.
US Regions' Vacation Spending As Percent of Per Capita GDP in 2015

The chart above shows the average vacation expenditures for overnight stays by US region as proportion of per capita GDP. All four US regions spend just above one percent of their per capita GDP on domestic travel.
EU and US Regions' Vacation Spending in 2015
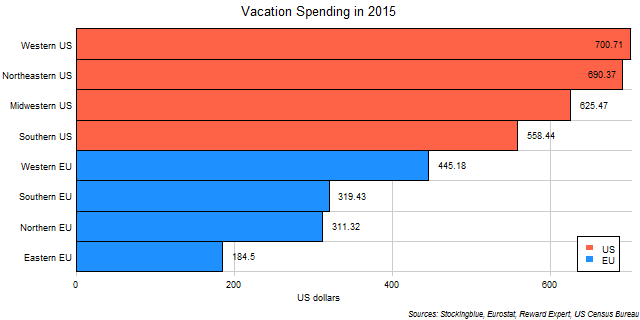
The chart above shows the average vacation expenditures for overnight stays by EU and US region in US dollars. All US regions spend more on vacations than any EU region does.
EU Regions' Vacation Spending in 2015

The chart above shows the average vacation expenditures for overnight stays by EU region. The Western EU is the region that spends the most on vacations by far.
US Regions' Vacation Spending in 2015

The chart above shows the average vacation expenditures for overnight stays by US region. The Western US slightly outspends the Northeastern US in vacation spending and is the only region that spends over $700 on vacations.
EU and US States' Vacation Spending As Percent of Per Capita GDP in 2015
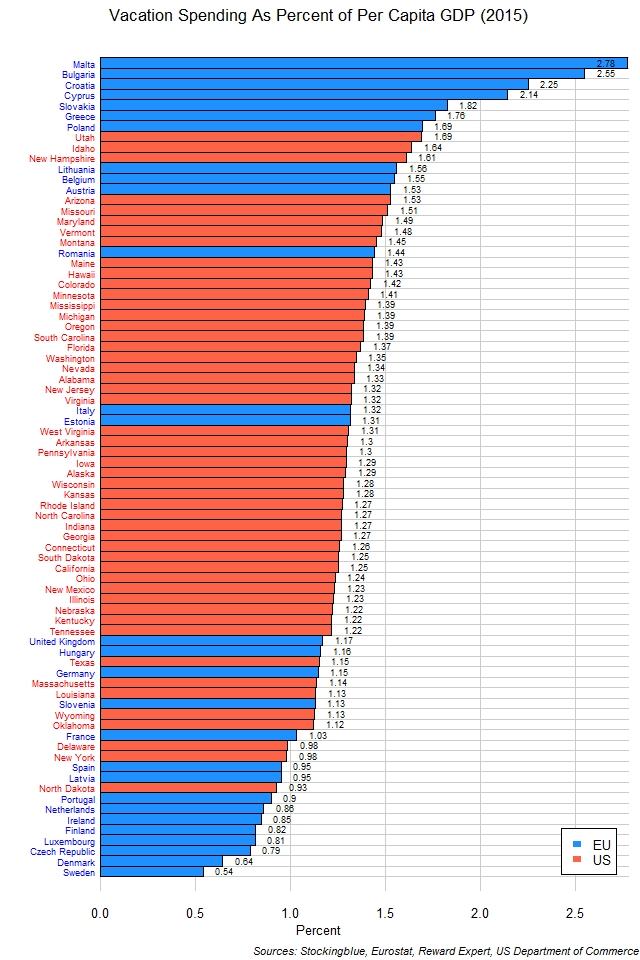
The chart above shows the average vacation expenditures for overnight stays by EU and US state as a proportion of per capita GDP. Americans are more uniform in their vacation spending than Europeans are whose vacation spending ranges from 0.5% of per capita GDP to nearly 3% of per capita GDP.
OlderNewer