EU States Ranked by Gross Domestic Product per Area
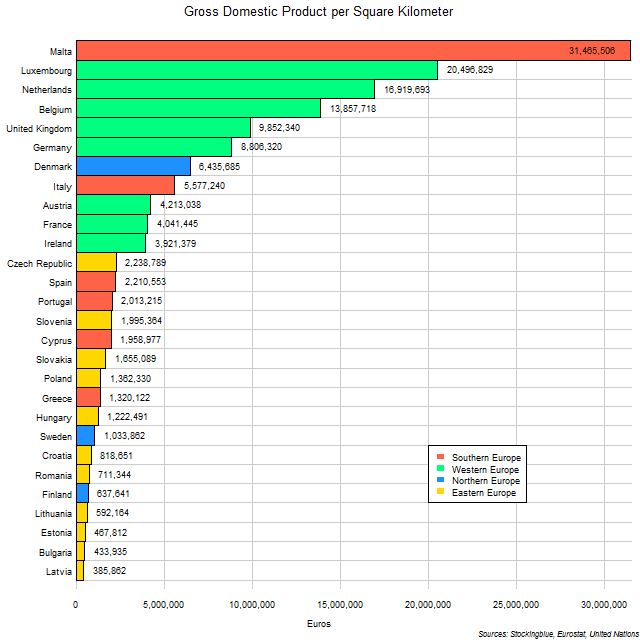
The chart above shows the Purchasing Power Parity Gross Domestic Product (GDP PPP) of EU states per square kilometer of territory. Even though Western EU states have relatively large states, they still manage an impressive showing.
EU and US Regions by Area
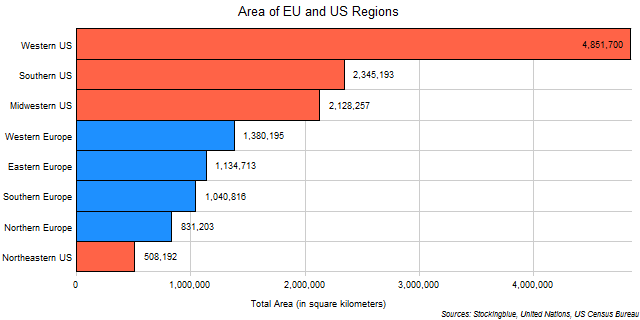
The chart above shows the area of each of the EU and US regions. The Western US is so large that it can fit the entirety of the European Union within it.
US Regions by Area

The chart above shows the area of each of the US regions. The Western US is so large that it takes all the three other regions to match its size.
EU Regions by Area

The chart above shows the area of each of the EU regions. Unlike population distribution and economic might, the land that the four major regions of the Union take up is relatively equal.
Comparison of EU and US States by Area
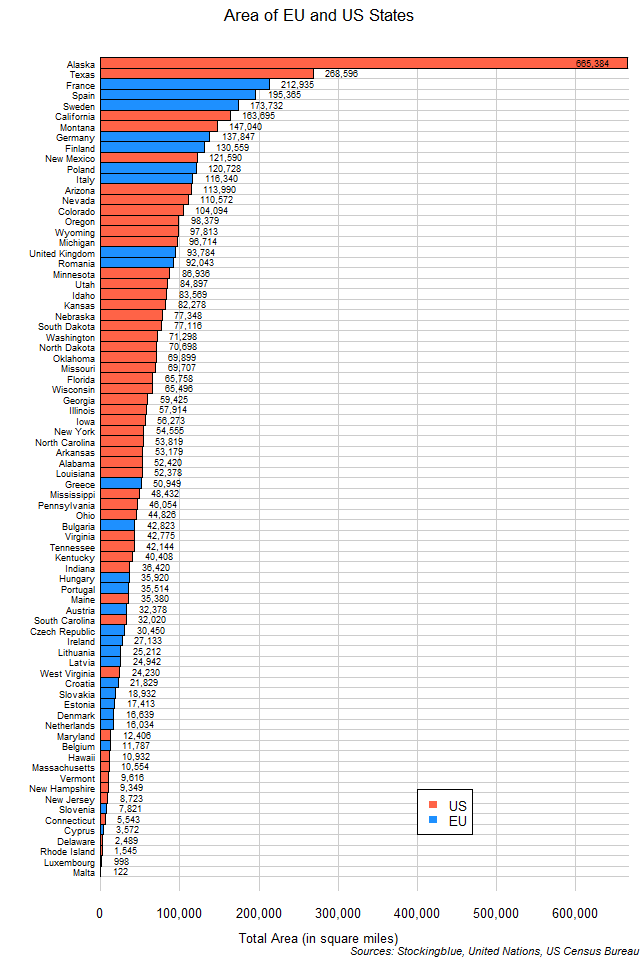
The chart above shows the area of each of the EU and US states. Alaska is so huge that it takes the next three largest states (Texas, France, and Spain) to rival its area.
Comparison of EU States by Area
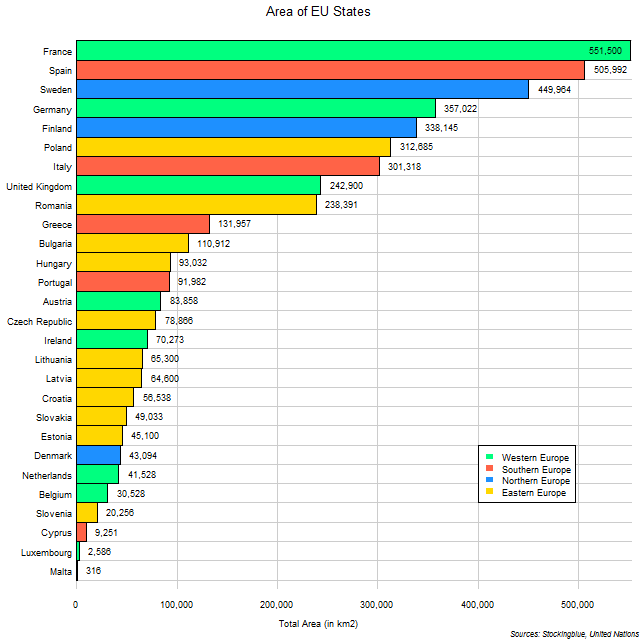
The chart above shows the area of each of the EU states. France, Spain, and Sweden are the only states with over 400,000 square kilometers.
Comparison of US States by Area
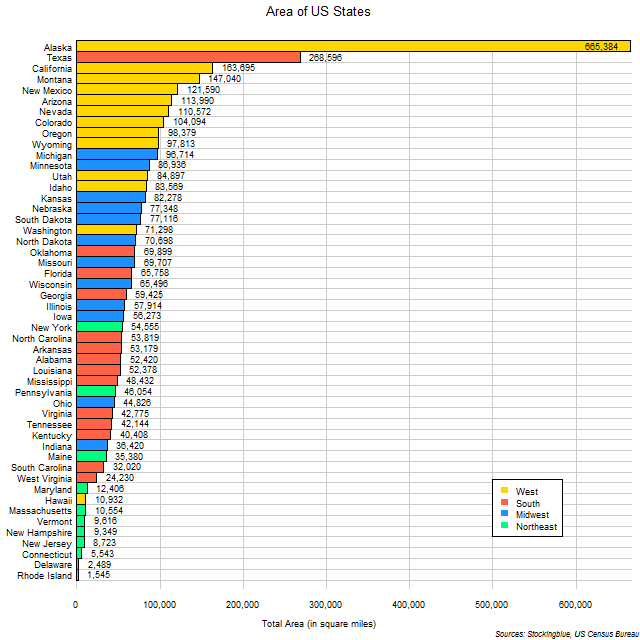
The chart above shows the area of each of the US states. Alaska and the Western US dominate the American expanse.
Regional Populations of the European Union and the United States
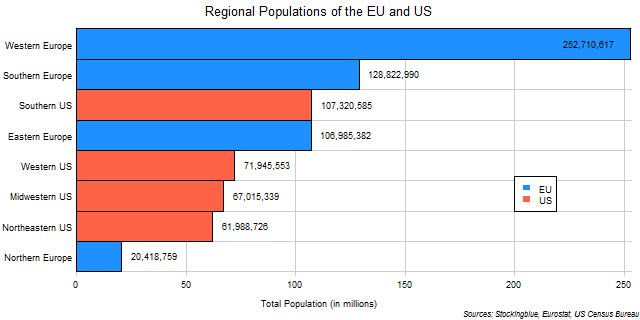
The chart above shows the regional populations of the European Union and the United States. There is a large disparity of population in European regions whereas the population differences are not all that great between American regions.
Regional Populations of the United States

The chart above shows the regional populations of the United States. As the US is a democracy, this shows where electoral power resides in the Union.
Regional Populations of the European Union

The chart above shows the regional populations of the European Union. As the EU is a democracy, this shows where electoral power resides in the Union.
OlderNewer