Proportion of Most Populous Cities in EU States
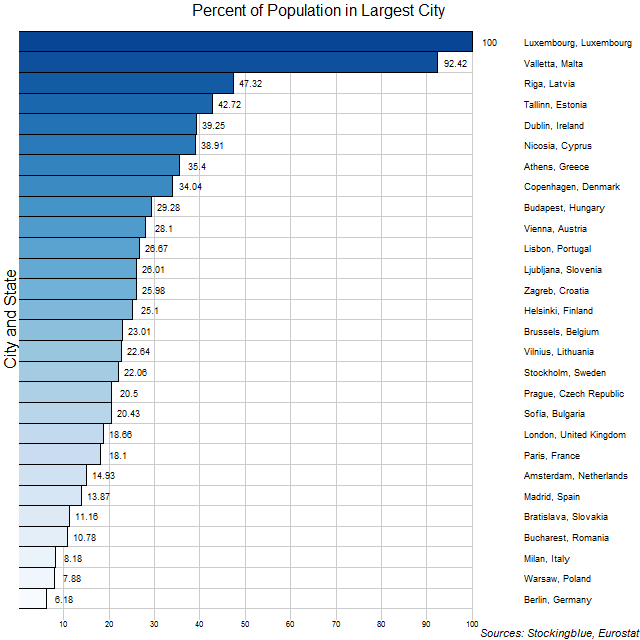
The chart above shows the most populous city in each EU state and the proportion of that nation's population that resides there. Luxembourg and Malta are obvious outliers due to their size but the rest of the EU still has quite a range from Berlin which only consists of just over one out of every twenty Germans to Riga which consists of just under one out of two Latvians.
Think Tanks in Europe and the United States
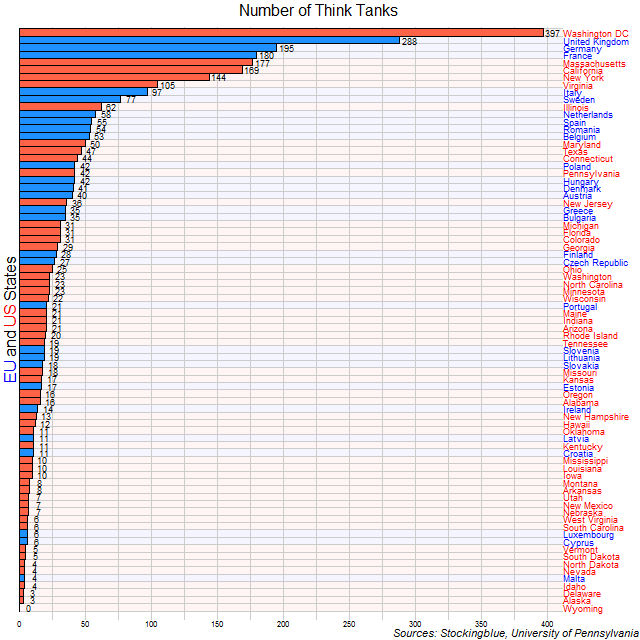
Most states in both the EU and the US do not bother with think tanks so much so, that the entity with the most think tanks by far, is not even a state. Outside of Washington DC, only the United Kingdom has more than 200 think tanks.
GDP and GDP Per Capita Growth between 2005 and 2016 in the European Union and the United States
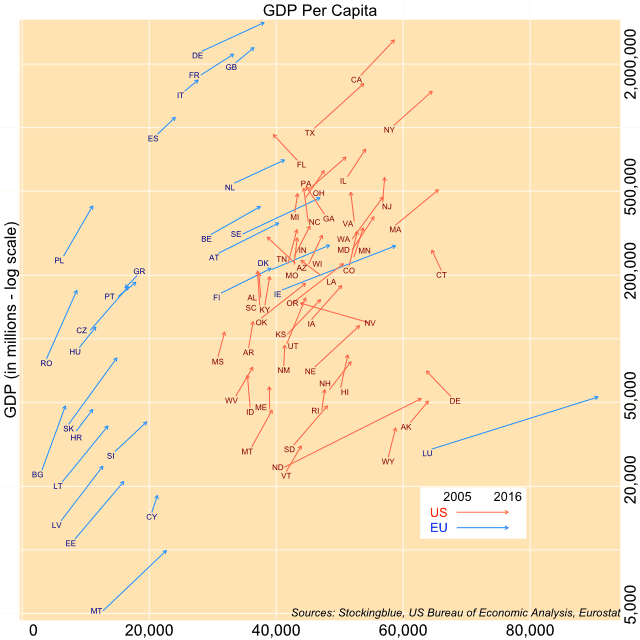
The chart above shows both the change in overall GDP (y-axis) and per capita GDP (x-axis) over a period of 11 years for EU and US states. All states except for one have experienced growth from 2005 to 2016. However, several states saw their per capita GDP decrease.
Fiber-Optic Penetration in Europe and the United States
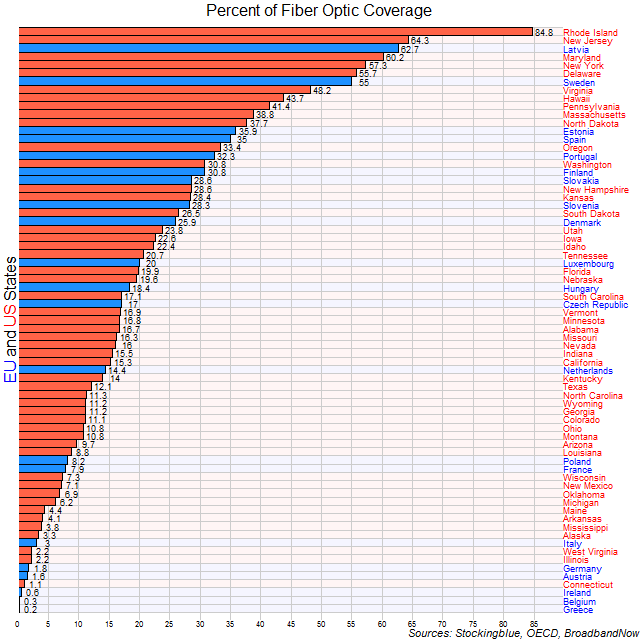
Most states in both the United States and the European Union are slow to pick up on fiber usage with only seven states from both superstates covering over half of their population. Ten of the top 12 states where fiber is most accessible are from the US.
A Comparison of Climates in European and American States
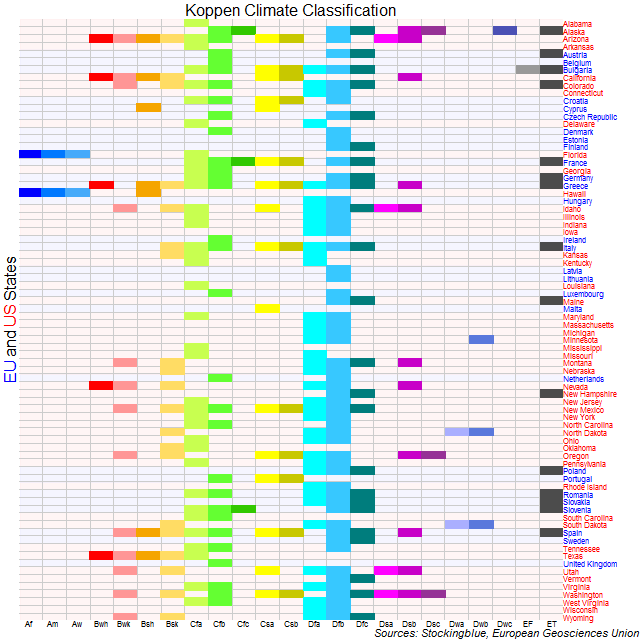
The European Union and the United States take up large swaths of geography but at the same time are broken down into states that allow for differences within the superstates to be examined further. Here, the climates that exist in these two entities are broken down by state. By far the most abundant climates in both entities are the continental and the temperate as classified by the most widely used climate classification system, the Köppen Climate Classification.
EU States by Annual Riders per Kilometer of Subway Track
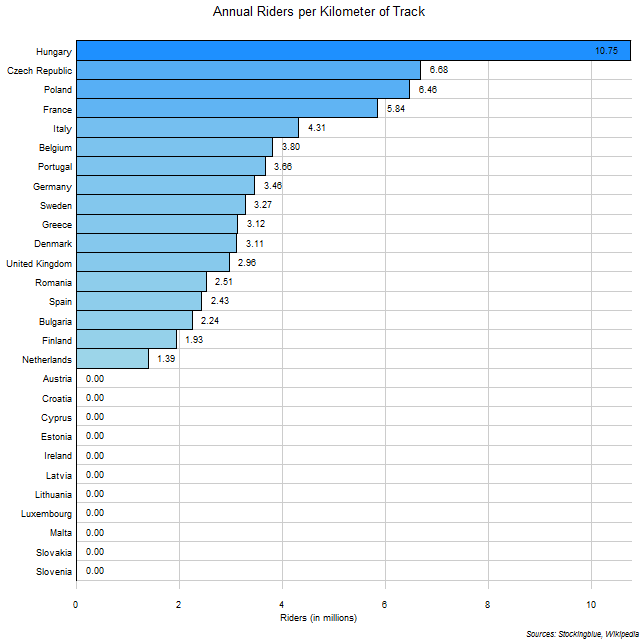
The chart above shows the number of annual riders for every kilometer of track in each state. One million annual riders is the equivalent of 2,740 riders a day. So the Netherlands has 3,808 daily riders for every kilometer of track while Hungary has 29,452.
Newer