Ratio of EU States' Unemployed within the EU to Total Population within the EU, December 2018
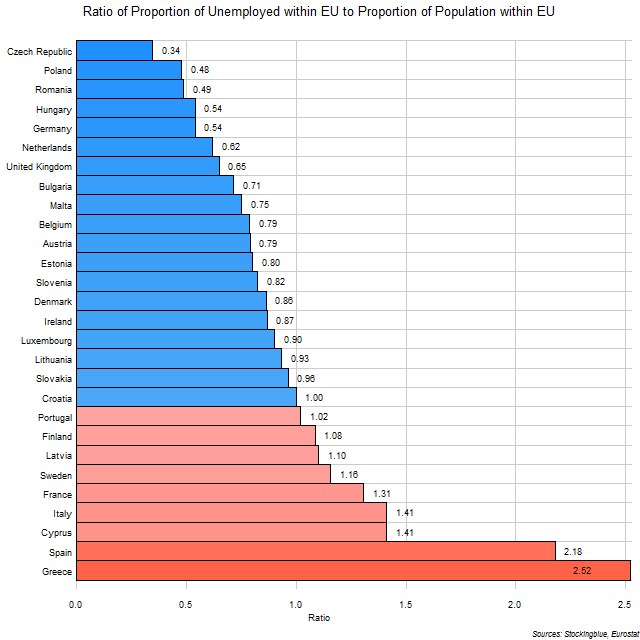
The chart above shows the ratio of the state's proportion of unemployed people in the EU to the state's proportion of total people in the EU. Nine states have an unemployed population that makes up a larger proportion of the EU total than their total population does. For instance, Spain's unemployed account for 20.05% of the total unemployed people in the EU whereas Spain's population only accounts for 9.20% of the total EU population, thus its ratio of unemployed within the EU to total people within the EU is 2.18, or its unemployed population accounts for over twice as much of the EU total than its total population does.
EU and US Unemployment Rates, December 2018
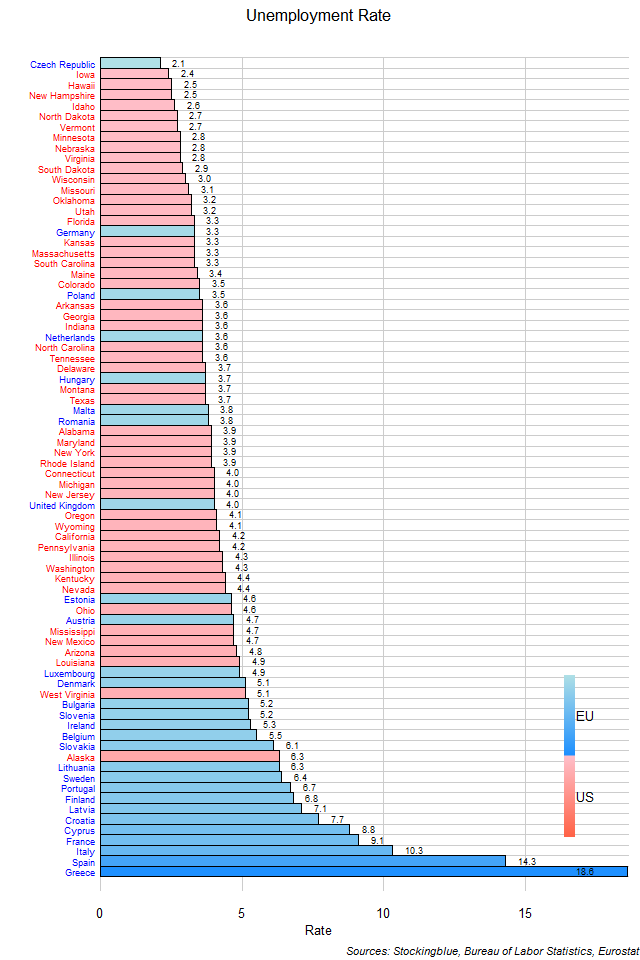
The chart above shows the unemployment rate in each EU and US state as of December 2018 (unless otherwise noted). Although the EU has the state with the lowest unemployment rate, it also has the states with the highest.
EU Unemployment Rates, December 2018
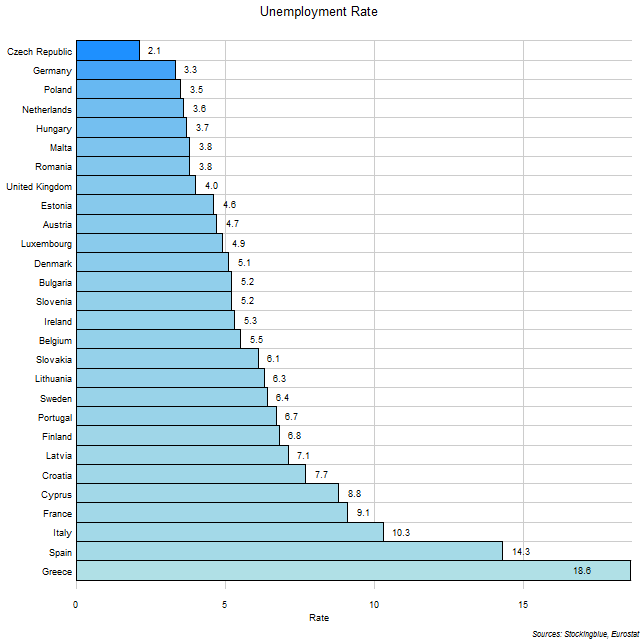
The chart above shows the unemployment rate in each EU state as of December 2018 (unless otherwise noted). The Czech Republic is the only state with a rate below three percent.
Air Travelers per Area in EU and US Regions
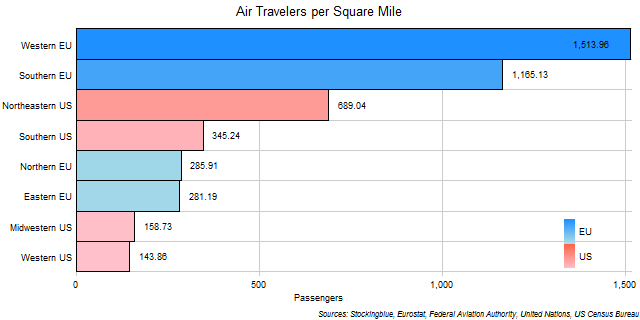
The chart above shows the number of passengers that traveled by air for every square mile in each EU and US region. The leading EU region has more than double the air passengers per square mile than the leading US region.
Air Travelers per Area in EU Regions

The chart above shows the number of passengers that traveled by air for every square kilometer in each EU region. The Eastern EU almost finally got a break and didn't finish last in one of these metrics but the Northern EU just barely squeaked by it.
Air Travelers per Area in EU and US States
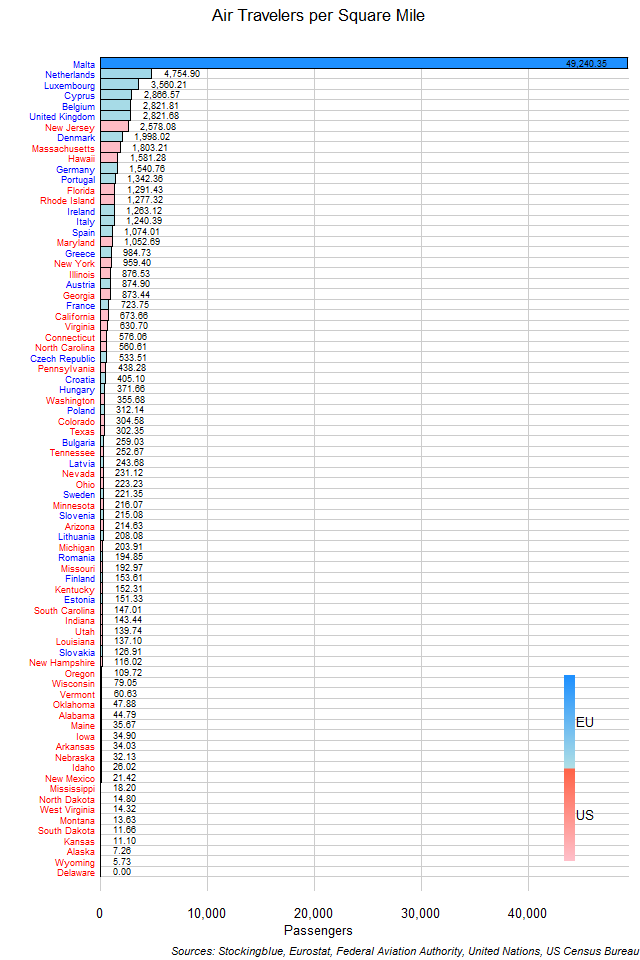
The chart above shows the number of passengers that traveled by air for every square mile in each EU and US state. No state in the EU or the US comes anywhere near the number of air passengers per square mile that Malta has.
Air Travelers per Area in EU States
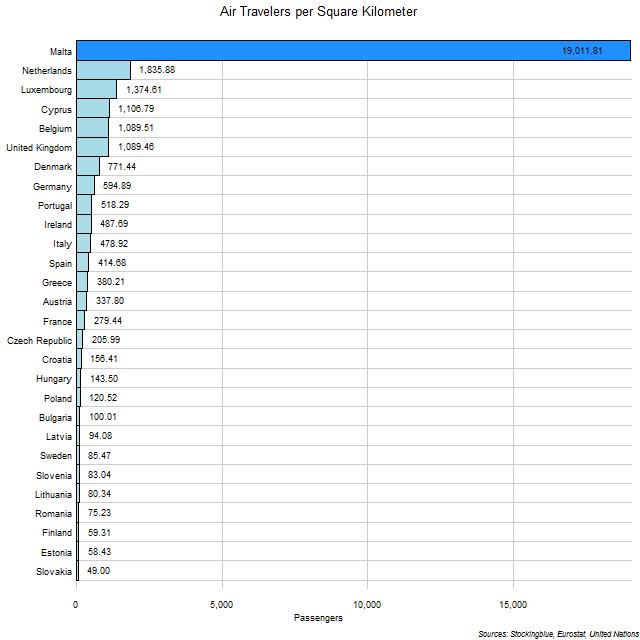
The chart above shows the number of passengers that traveled by air for every square kilometer in each EU state. Malta is in a class by itself.
Net Worth of Billionaires per Square Mile in EU and US Regions in 2018
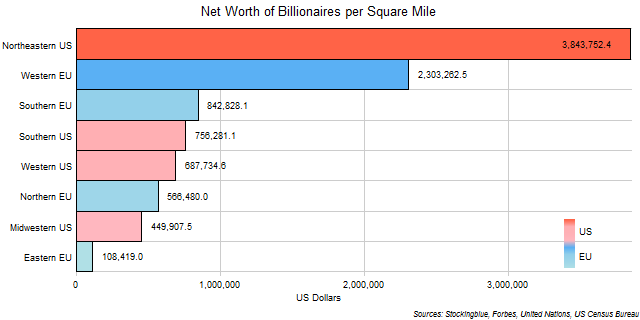
The chart above shows the net worth of the billionaires of each region per square mile. The Northeastern US and the Western EU are the only regions whose billionaires have a net worth per square mile of over $1 million.
Net Worth of Billionaires per Square Kilometer in EU Regions in 2018

The chart above shows the net worth of the billionaires of each region per square kilometer. The Western EU leads all other regions by a huge margin.
Net Worth of Billionaires per Square Mile in EU and US States in 2018
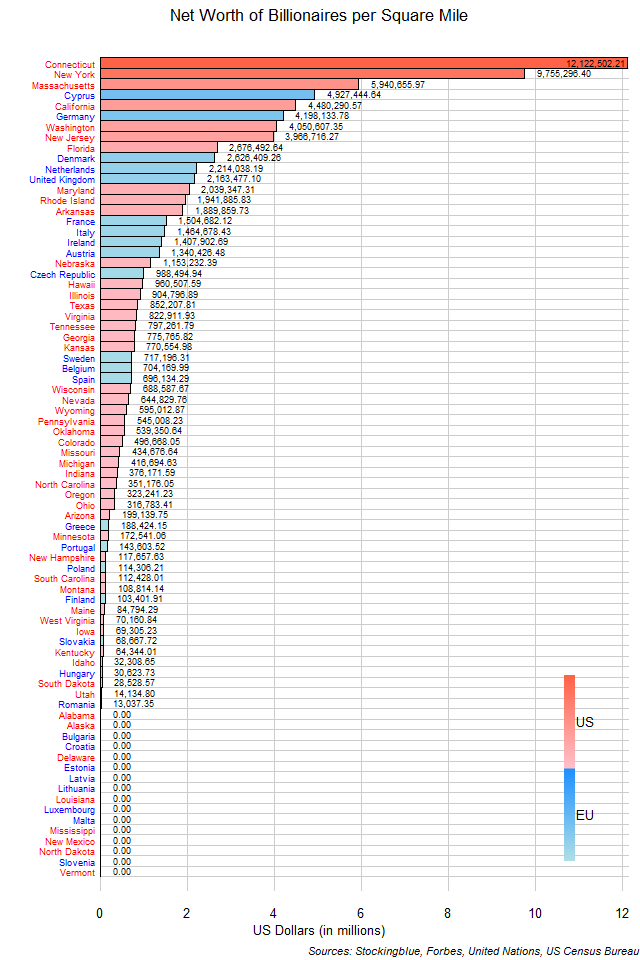
The chart above shows the net worth of the billionaires of each state per square mile. The top three states are all from the US as are four out of the top five and seven out of the top ten.
OlderNewer