GDP and Change in GDP in EU States between 2016 and 2017
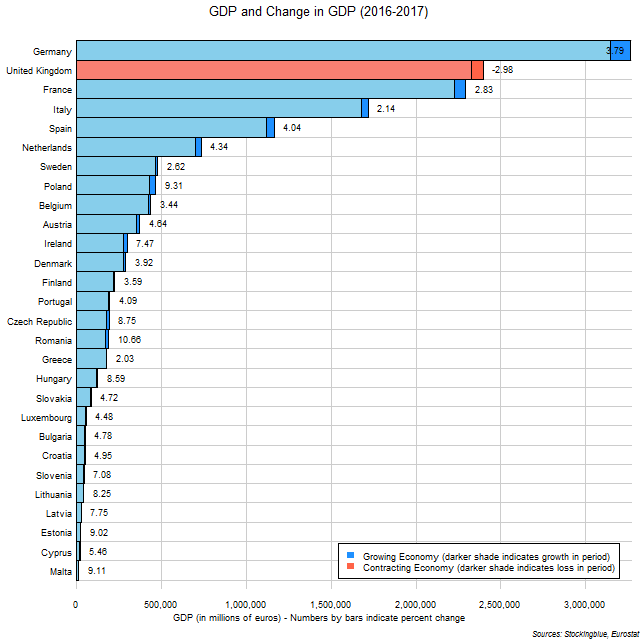
The chart above shows the GDP and change in GDP over the last year in EU states in euros. Although Germany had far from the greatest relative growth at 3.79%, it had the largest absolute growth in the Union nearly double that of the second largest absolute growth seen in France and German growth accounted for over one out of every four euros of growth in the entire Union.
GDP and Change in GDP in EU Regions between 2008 and 2017

The chart above shows the GDP and change in GDP over the last ten years in EU regions in euros. All four regions grew in the past ten years however, the Southern EU had a considerably small relative growth rate than the other three regions.
GDP and Change in GDP in EU and US States between 2008 and 2017
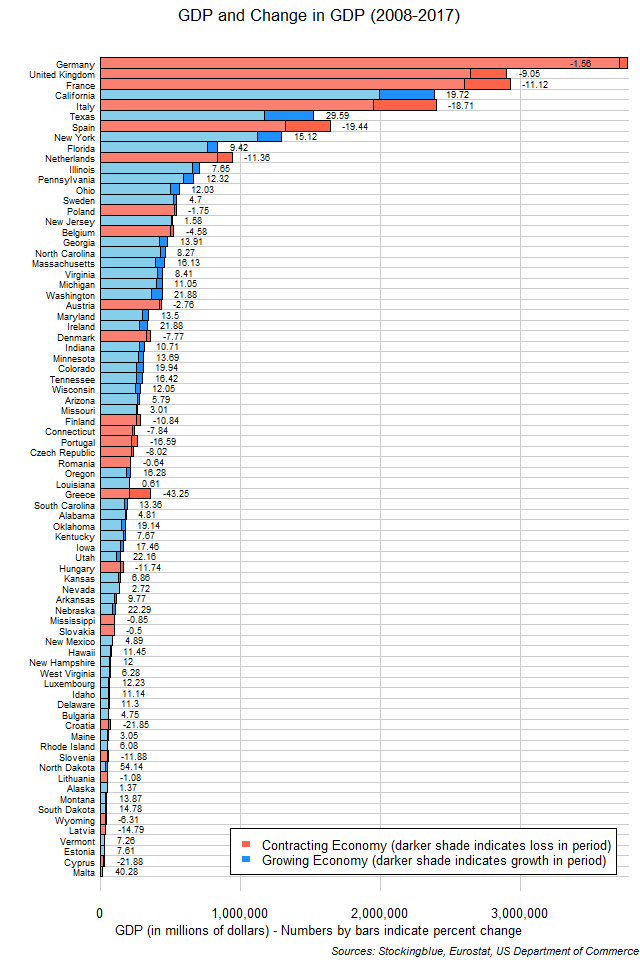
The chart above shows the GDP and change in GDP over the last ten years in EU and US states in US dollars. Although the three largest economies all shrank in the ten year period, they managed to remain the three largest economies, even though the second and third largest economies swapped places.
GDP and Change in GDP in EU States between 2008 and 2017
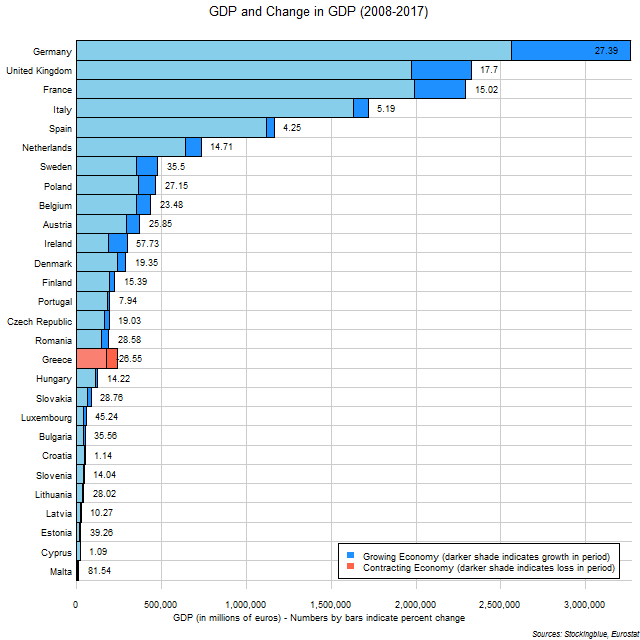
The chart above shows the GDP and change in GDP over the last ten years in EU states. The German economy grew by more in the past ten years than the entire economy of 22 EU states.
Economic Growth and Contraction in EU Regions between 2016 and 2017

The chart above shows change in GDP over the last year in EU regions. The Eastern EU grew by more than twice as much as the second fastest growing region last year.
Economic Growth and Contraction in EU and US States between 2016 and 2017
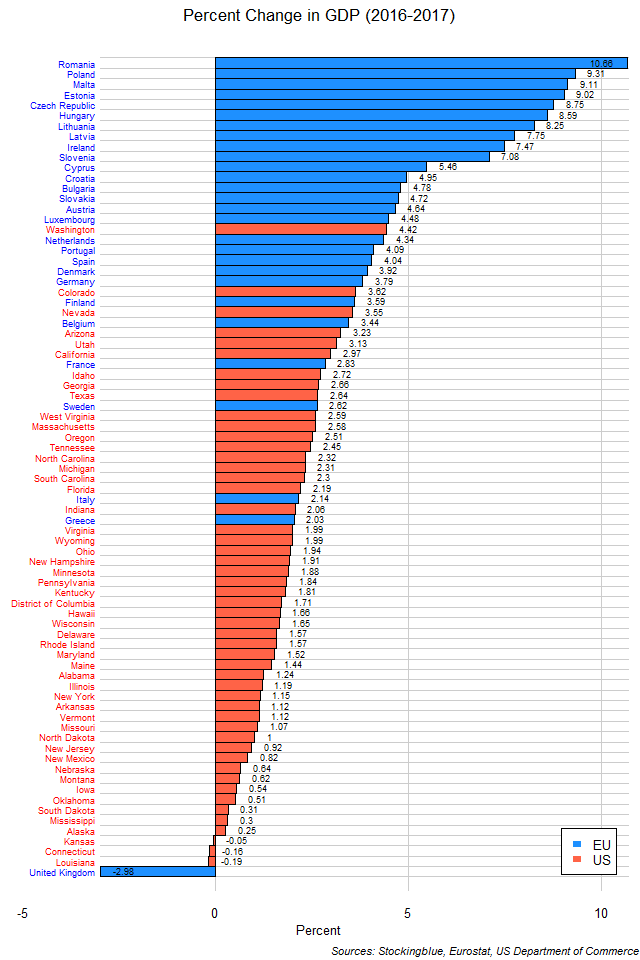
The chart above shows change in GDP over the last year in EU and US states. The 16 fastest growing states last year were all in the EU. The fastest growing US state ranks 17th overall. However, the state with the largest contraction is also from the EU (although not for long).
Economic Growth and Contraction in EU States between 2016 and 2017
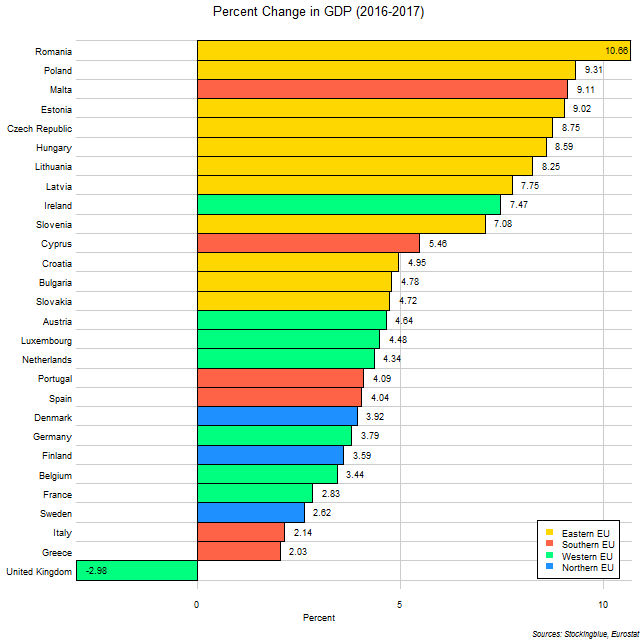
The chart above shows change in GDP over the last year in EU states. Only Romania has grown its economy by over a tenth while the United Kingdom is the only EU state whose economy shrank over the past year.
Economic Growth and Contraction in EU Regions between 2008 and 2017

The chart above shows change in GDP over the last ten years in EU regions. While the Northern, Eastern, and Western regions of the EU grew by at least one-fifth, the Southern EU has seen nearly no economic growth in the past ten years.
Economic Growth and Contraction in EU and US States between 2008 and 2017
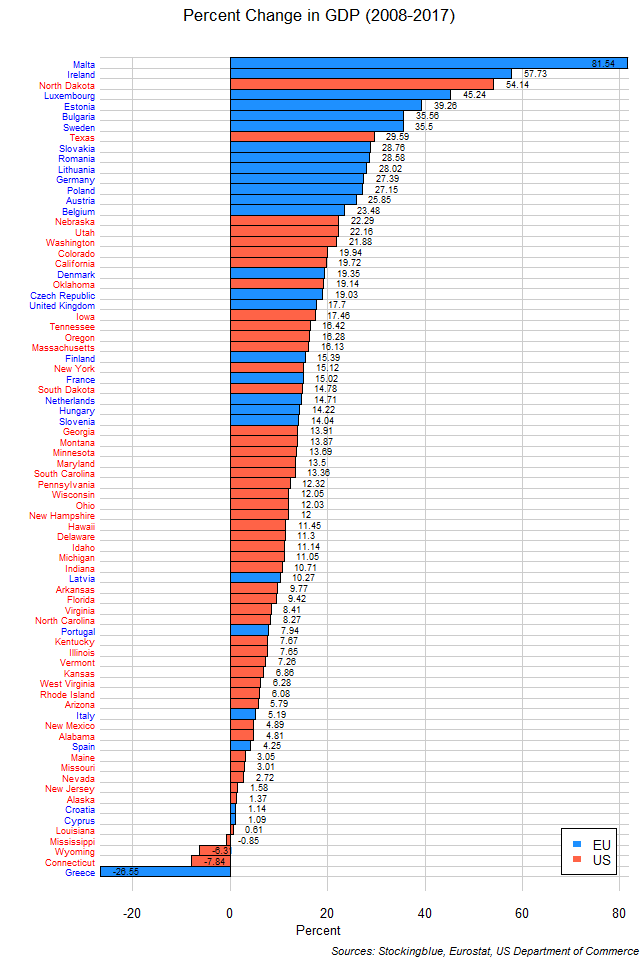
The chart above shows change in GDP over the last ten years in EU and US states. Only two US states rank in the top ten in economic growth over the past decade. Conversely, US states make up seven of the ten worst performers but it is an EU state that has had the worst economic contraction by far.
Economic Growth and Contraction in EU States between 2008 and 2017
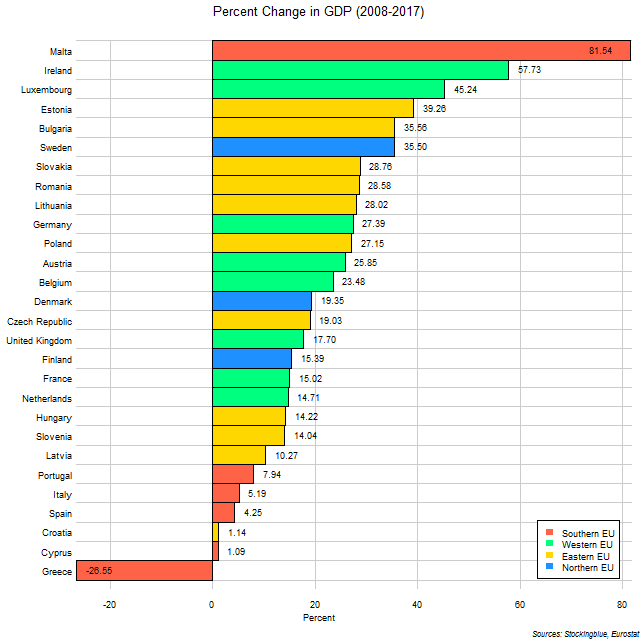
The chart above shows change in GDP over the last ten years in EU states. Malta and Ireland are the only two states to have increased their economies by half. Four other states managed to increase theirs by one-third and an additional six grew their economies by one-quarter. One economy shrank in the past ten years.
OlderNewer