Comparison of EU States by Area
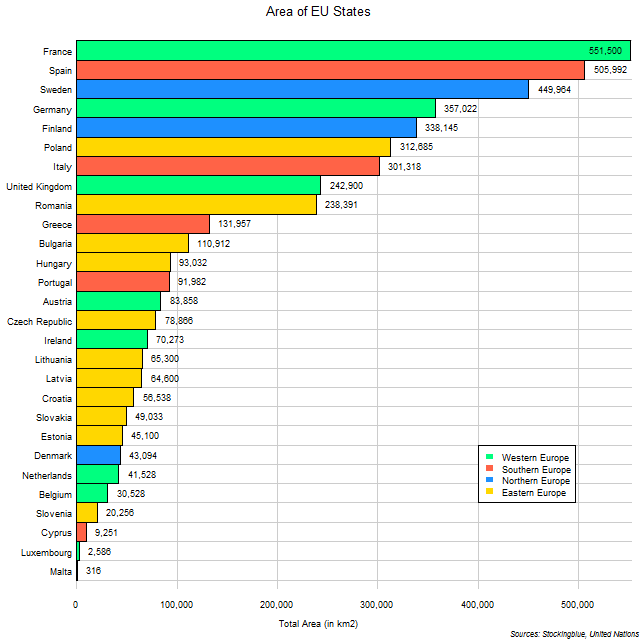
The chart above shows the area of each of the EU states. France, Spain, and Sweden are the only states with over 400,000 square kilometers.
Regional Populations of the European Union and the United States
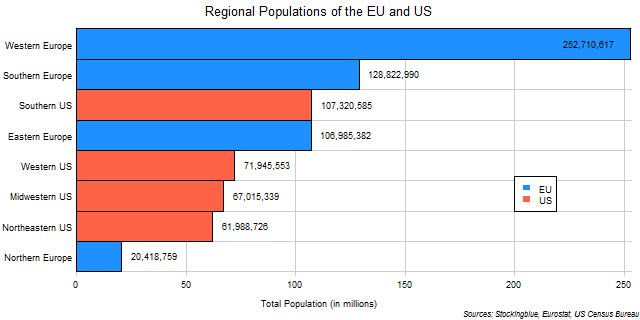
The chart above shows the regional populations of the European Union and the United States. There is a large disparity of population in European regions whereas the population differences are not all that great between American regions.
Regional Populations of the European Union

The chart above shows the regional populations of the European Union. As the EU is a democracy, this shows where electoral power resides in the Union.
Per Capita Gross Domestic Product of EU Regions
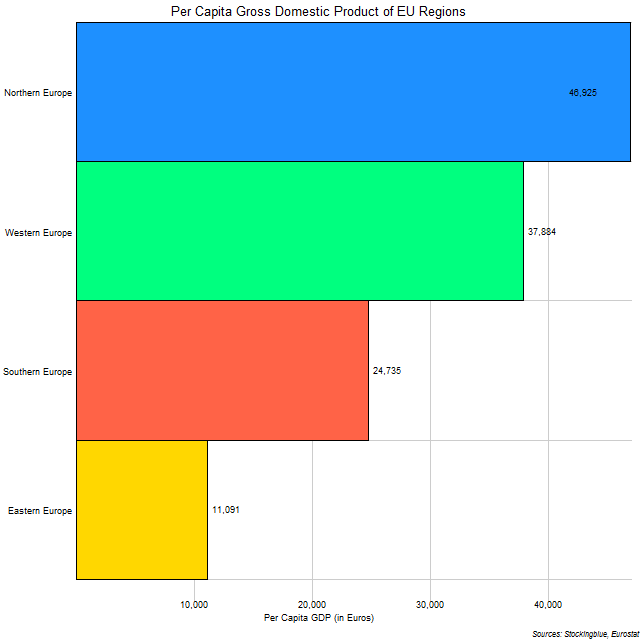
The chart above shows the per capita GDP of EU regions. Although as was shown in a previous report, Northern Europe has the smallest GDP, it does significantly better when GDP is measured on a per capita basis, having the largest of the four main regions.
Per Capita Gross Domestic Product in EU and US States
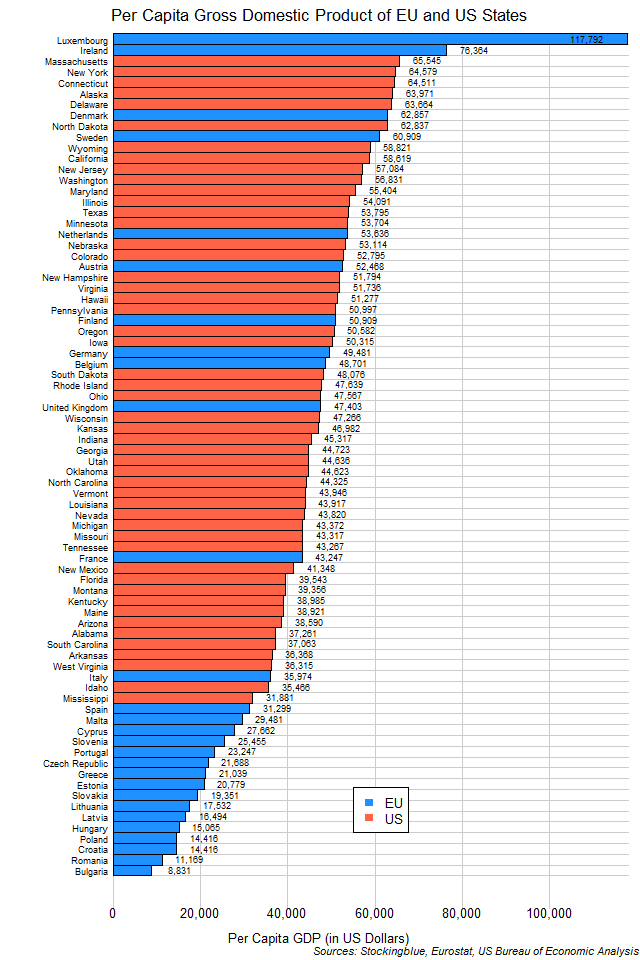
The chart above shows the per capita GDP of EU and US states. Although the EU has the two states with the highest per capita GDP, it also has the 16 states with the lowest per capita GDP.
EU States by Per Capita Gross Domestic Product
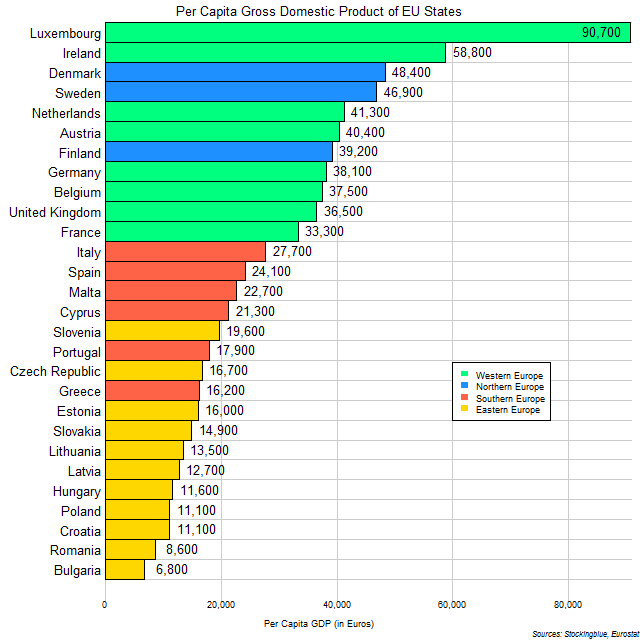
The chart above shows the per capita GDP of EU states. Northern and Western European states all have a per capita GDP of over €30,000 while all Southern and Eastern European states fall below that threshold.
EU and US Regions by Gross Domestic Product
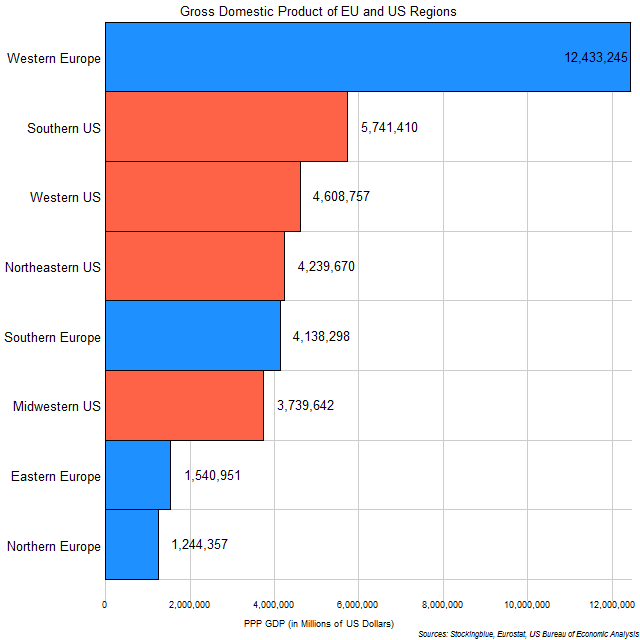
The chart above shows the regional economies of the European Union and the United States. Clearly wealth is distributed far more equally between regions in the US than it is in the EU.
EU Regions by Gross Domestic Product
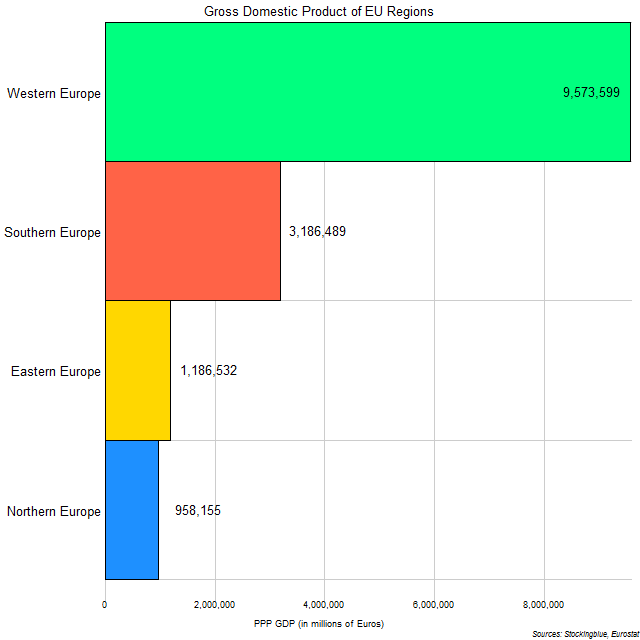
The chart above shows the regional economies of the European Union. The largest regional economy, Western Europe completely dominates the EU's economy.
EU and US Cities and States Ranked by Gross Domestic Product
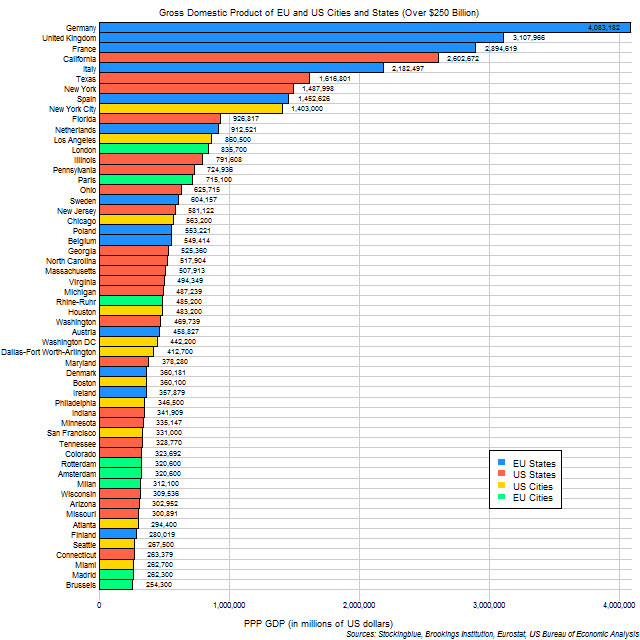
The chart above shows the state and city economies of both the European Union and the United States with GDPs over $250 billion. The EU has the largest state economy but the US has the largest city economy. Below, the remaining states and metropolitan areas that are amongst the 300 largest metropolitan economies in the world with GDPs under $250 billion.
EU Cities and States Ranked by Gross Domestic Product
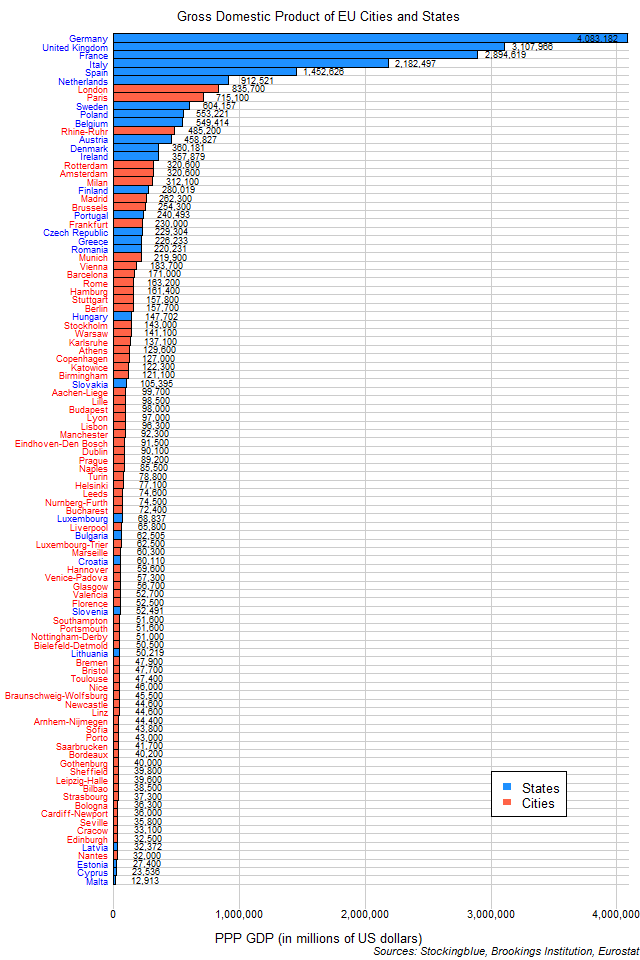
The chart above shows the state and city economies of the European Union. The largest metropolitan economy, London, would rank seventh if it were a state. The list only includes the metropolitan areas that are amongst the 300 largest metropolitan economies in the world.
OlderNewer