Per Capita GDP by US State, Fourth Quarter 2018
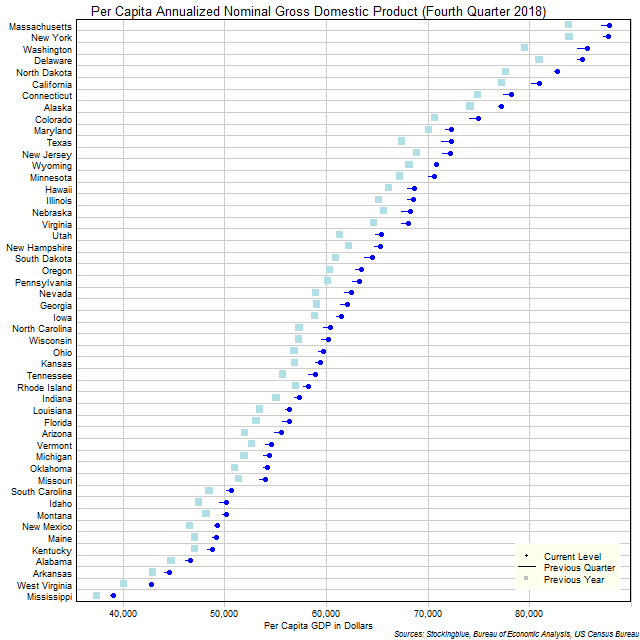
The chart above shows the per capita annualized nominal gross domestic product (GDP) in each US state as of the fourth quarter of 2018 in dollars, the change from the previous quarter, and the GDP one year prior. Every single state's per capita GDP grew both over the past quarter and the past year.
EU and US GDP by Region, Fourth Quarter 2018
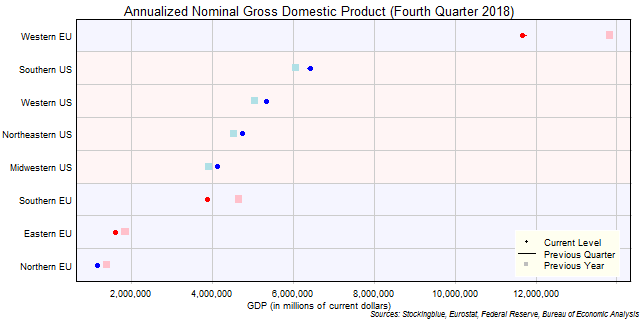
The chart above shows the annualized nominal gross domestic product (GDP) in each EU and US region as of the fourth quarter of 2018 in millions of dollars, the change from the previous quarter, and the GDP one year prior. The Western EU is the only EU region that has a larger GDP than any US region.
EU GDP by Region, Fourth Quarter 2018

The chart above shows the annualized nominal gross domestic product (GDP) in each EU region as of the fourth quarter of 2018 in millions of euros, the change from the previous quarter, and the GDP one year prior. Every single region's economy grew both over the past quarter and the past year.
US GDP by Region, Fourth Quarter 2018

The chart above shows the annualized nominal gross domestic product (GDP) in each US region as of the fourth quarter of 2018 in millions of dollars, the change from the previous quarter, and the GDP one year prior. Every single region's economy grew both over the past quarter and the past year.
EU and US GDP by State, Fourth Quarter 2018
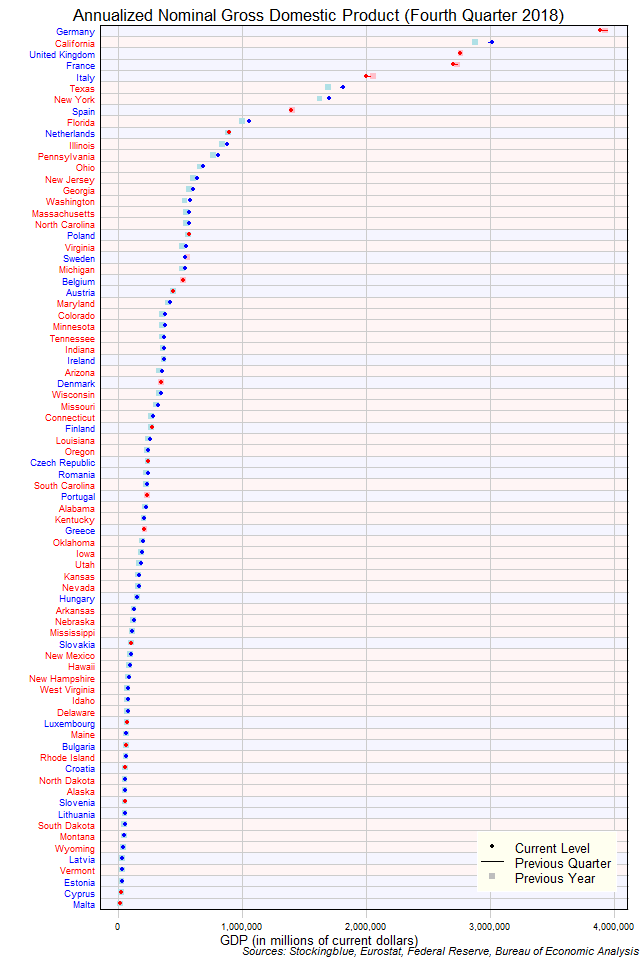
The chart above shows the annualized nominal gross domestic product (GDP) in each EU and US state as of the fourth quarter of 2018 in millions of US dollars, the change from the previous quarter, and the GDP one year prior. Only five states in both the EU and the US (four of which are from the EU) have an annualized GDP of over $2 trillion.
EU GDP by State, Fourth Quarter 2018
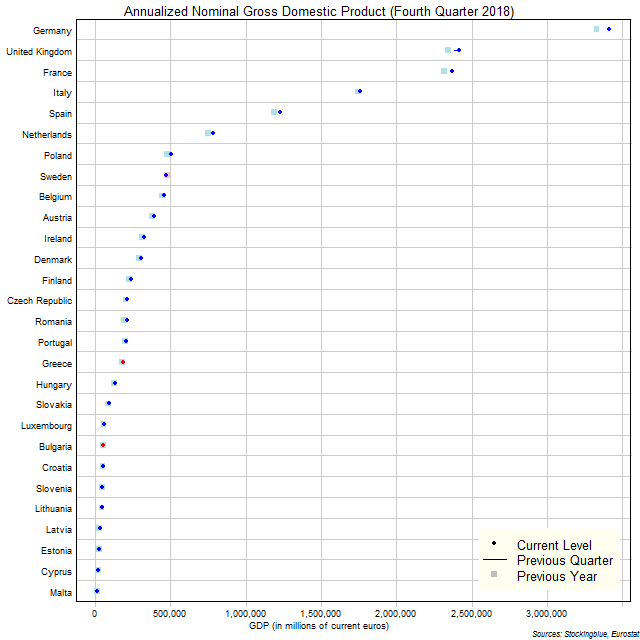
The chart above shows the annualized nominal gross domestic product (GDP) in each EU state as of the fourth quarter of 2018 in millions of euros, the change from the previous quarter, and the GDP one year prior. Germany is the only state with an annualized GDP of over €3 trillion.
US GDP by State, Fourth Quarter 2018
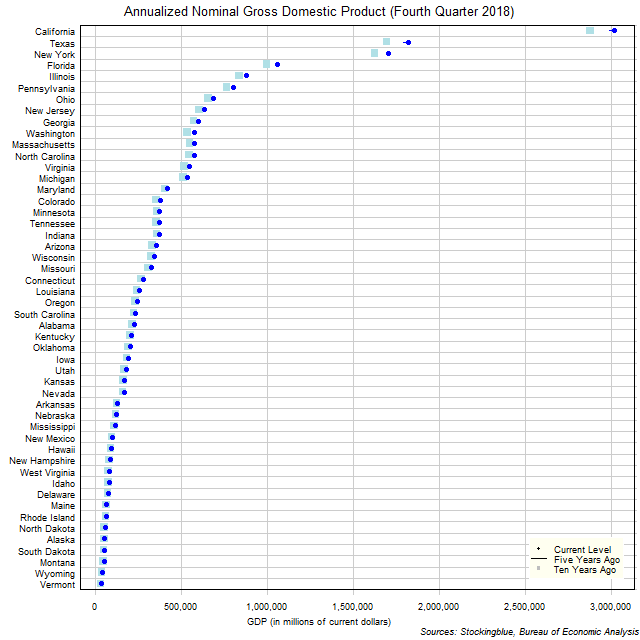
The chart above shows the annualized nominal gross domestic product (GDP) in each US state as of the fourth quarter of 2018 in millions of dollars, the change from the previous quarter, and the GDP one year prior. Every single state's economy grew both over the past quarter and the past year.
Per Capita GDP and Change in Per Capita GDP in EU and US Regions between 2016 and 2017
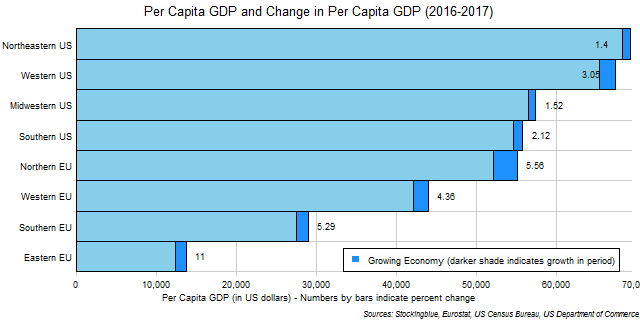
The chart above shows the per capita GDP and change in per capita GDP over the last year in EU and US regions in US dollars. All four US regions have higher per capita GDPs than the four EU regions, however all four EU regions had higher growth rates than all four US regions and if current trends continue, one EU region will overtake one US region this year.
Per Capita GDP and Change in Per Capita GDP in US Regions between 2016 and 2017

The chart above shows the per capita GDP and change in per capita GDP over the last year in US regions. The Northeast may have the highest per capita GDP but last year it has had the lowest growth rate in the metric allowing all other regions to catch up to it.
Per Capita GDP and Change in Per Capita GDP in EU Regions between 2016 and 2017

The chart above shows the per capita GDP and change in per capita GDP over the last year in EU regions. The Eastern EU had the highest growth rate in the metric but the Northern EU had the highest overall growth and managed to maintain its lead over all other EU regions.
OlderNewer