Economic Growth and Contraction in EU and US States between 2008 and 2017
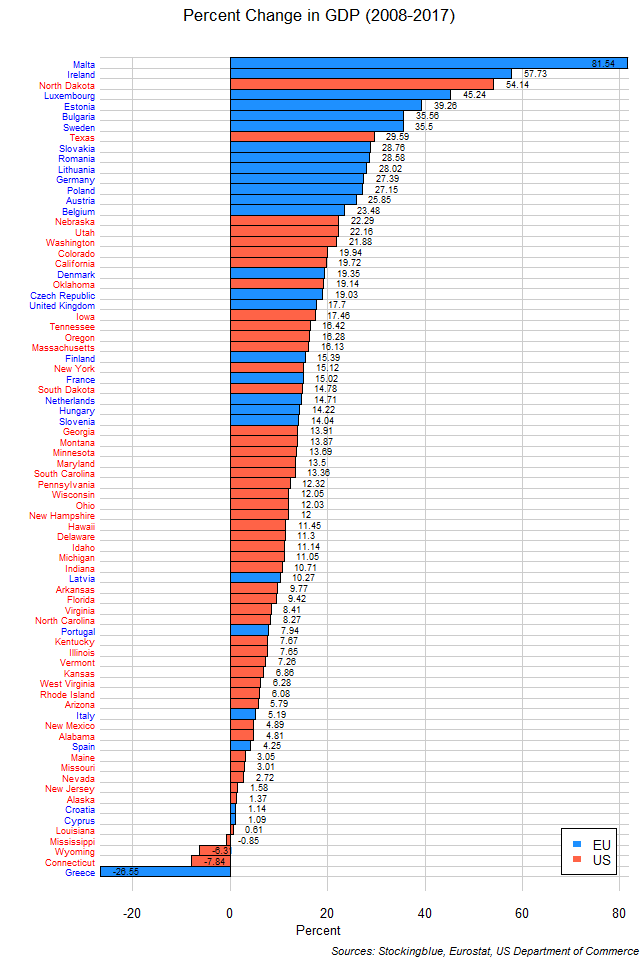
The chart above shows change in GDP over the last ten years in EU and US states. Only two US states rank in the top ten in economic growth over the past decade. Conversely, US states make up seven of the ten worst performers but it is an EU state that has had the worst economic contraction by far.
Economic Growth and Contraction in US States between 2008 and 2017
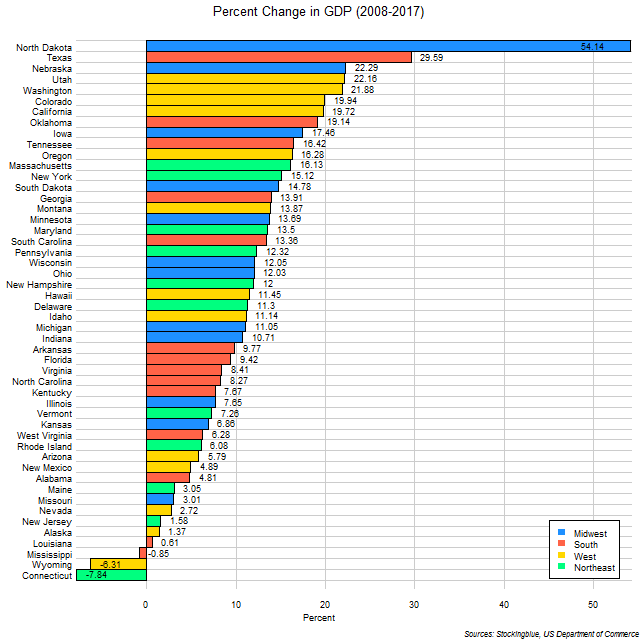
The chart above shows change in GDP over the last ten years in US states. North Dakota is the only state to grow its economy by half over the past ten years. Texas grew its economy by a quarter, while three states saw their economy contract.
Economic Growth and Contraction in EU States between 2008 and 2017
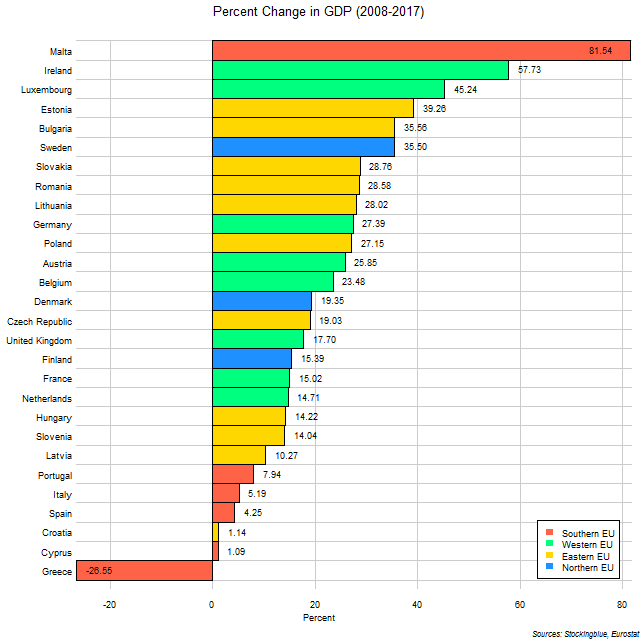
The chart above shows change in GDP over the last ten years in EU states. Malta and Ireland are the only two states to have increased their economies by half. Four other states managed to increase theirs by one-third and an additional six grew their economies by one-quarter. One economy shrank in the past ten years.
Transportation-Based Carbon Dioxide Emissions for Every Thousand Dollars of GDP in EU and US Regions
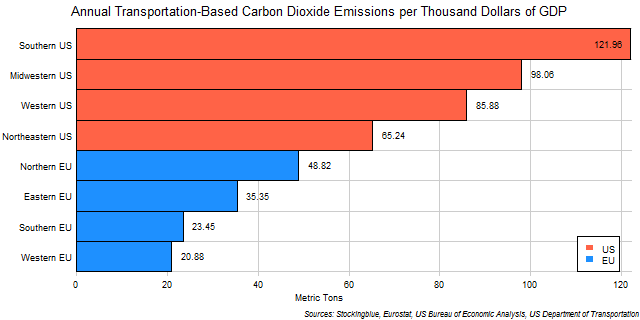
The chart above shows transportation-based carbon dioxide emissions broken down by economic output in EU and US regions. Every single US region emits more than every single EU region.
Transportation-Based Carbon Dioxide Emissions for Every Thousand Euros of GDP in EU Regions

The chart above shows transportation-based carbon dioxide emissions broken down by economic output in EU regions. The Northern EU is by far the leading emitter of transportation-based carbon dioxide in this metric.
Transportation-Based Carbon Dioxide Emissions for Every Thousand Dollars of GDP in US Regions

The chart above shows transportation-based carbon dioxide emissions broken down by economic output in US regions. The South is by far the leading emitter of transportation-based carbon dioxide in this metric.
Transportation-Based Carbon Dioxide Emissions for Every Thousand Dollars of GDP in EU and US States
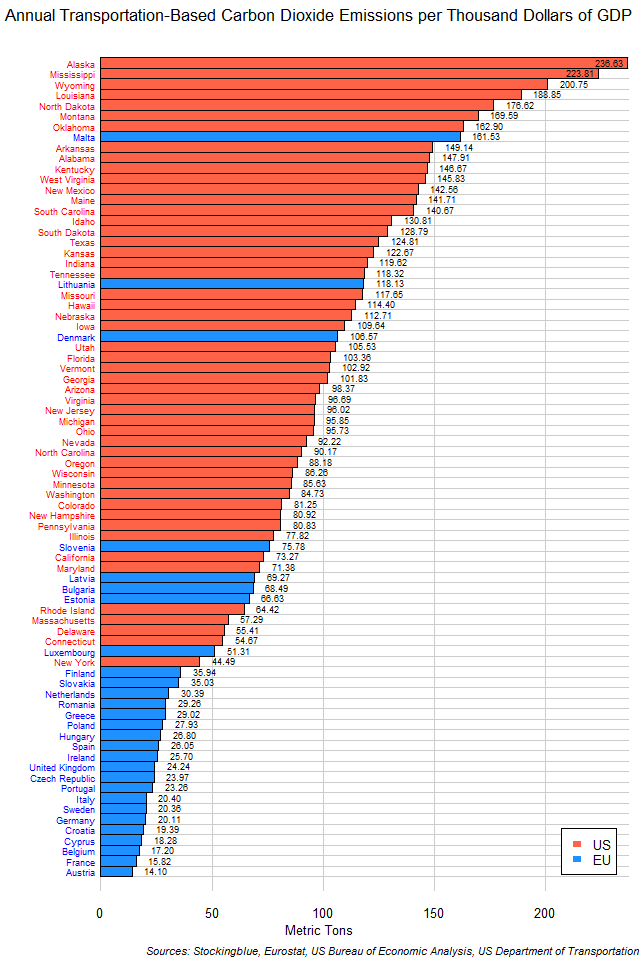
The chart above shows transportation-based carbon dioxide emissions broken down by economic output in EU and US states. Only one EU state ranks in the top 20 emitters. Not one US state is in the bottom 20 in this metric.
Transportation-Based Carbon Dioxide Emissions for Every Thousand Euros of GDP in EU States
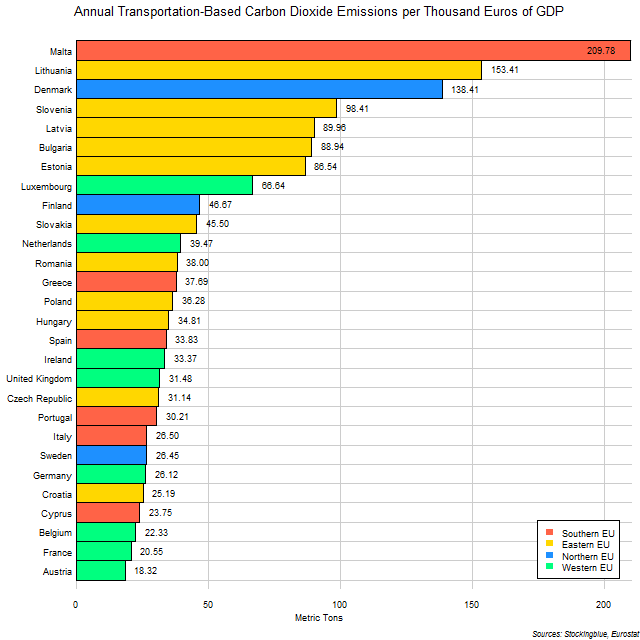
The chart above shows transportation-based carbon dioxide emissions broken down by economic output in EU states. Three out of the top five polluting states in this metric are from the Eastern EU.
Transportation-Based Carbon Dioxide Emissions for Every Thousand Dollars of GDP in US States
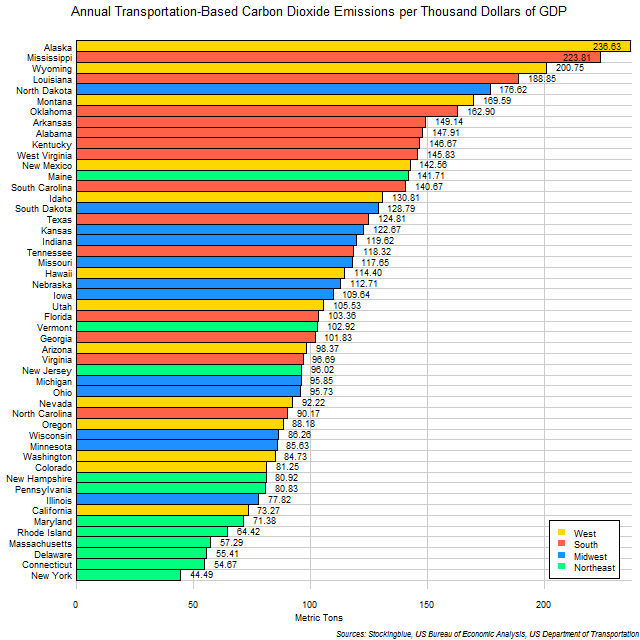
The chart above shows transportation-based carbon dioxide emissions broken down by economic output in US states. Six of the top ten emitting states are in the South and if Alaska is excluded due to its unique transportation network, seven of the top ten are from the South.
Per Capita Gross Domestic Product in EU and US States
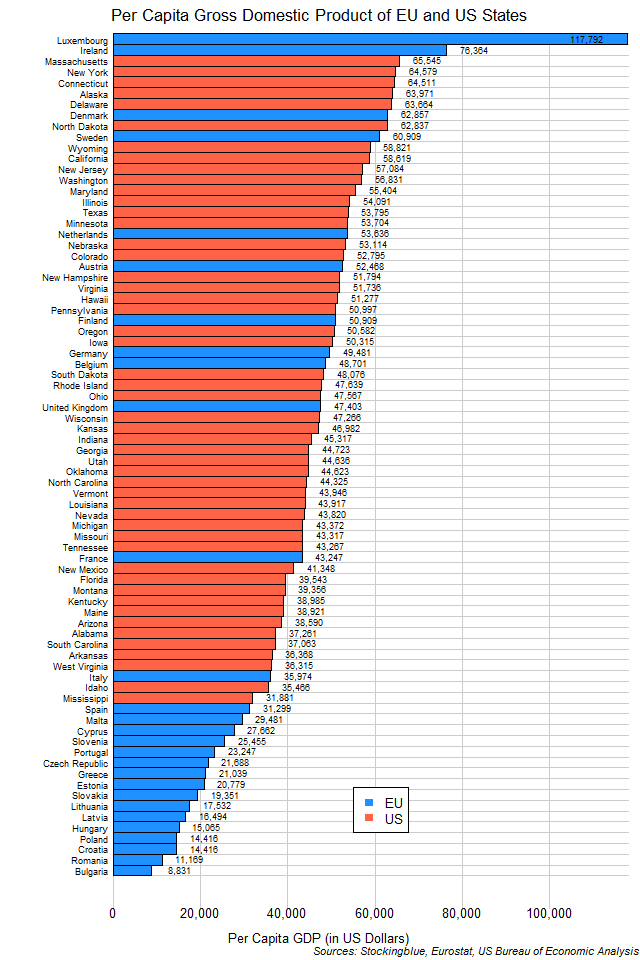
The chart above shows the per capita GDP of EU and US states. Although the EU has the two states with the highest per capita GDP, it also has the 16 states with the lowest per capita GDP.
OlderNewer