The Largest National Economies in the EU
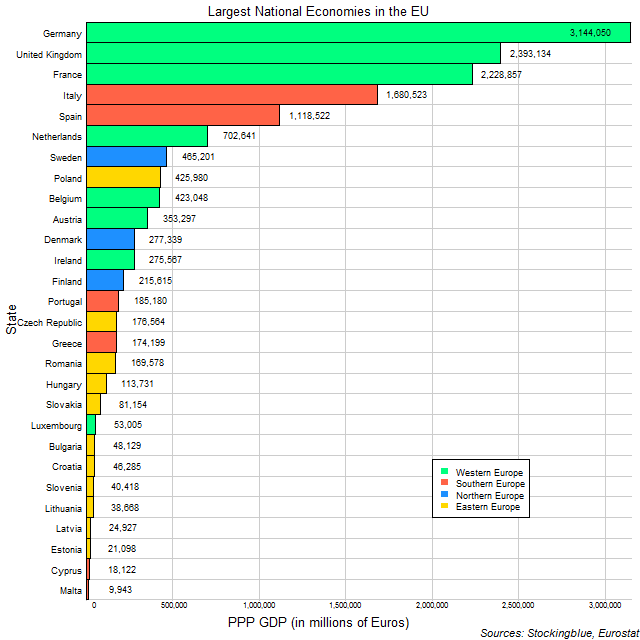
The chart above shows the largest national economies in the EU. Clearly, Western Europe dominates the EU with the top three economies all coming from the region and claiming four of the top six largest economies.
The Largest Metropolitan Economies in the EU and the US
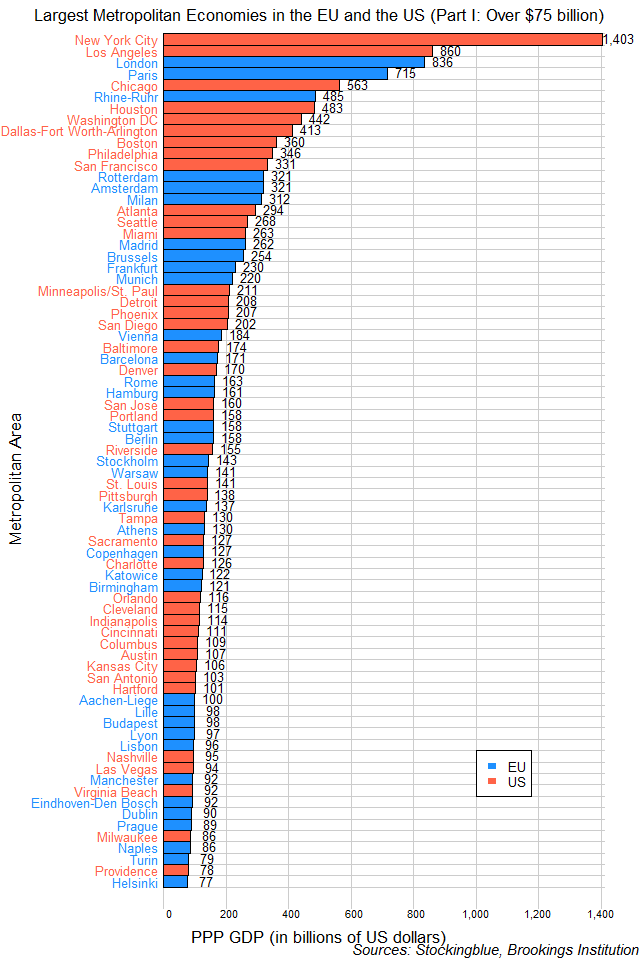
The chart above shows the largest metropolitan economies in the EU and the US that happen to also be among the world's largest 300 metropolitan economies based on the Brookings Institution and have a GDP of over $75 billion. Below, the chart with the cities in the EU and the US among the world's 300 largest with a GDP of $75 billion or less.
The Largest Metropolitan Economies in the US
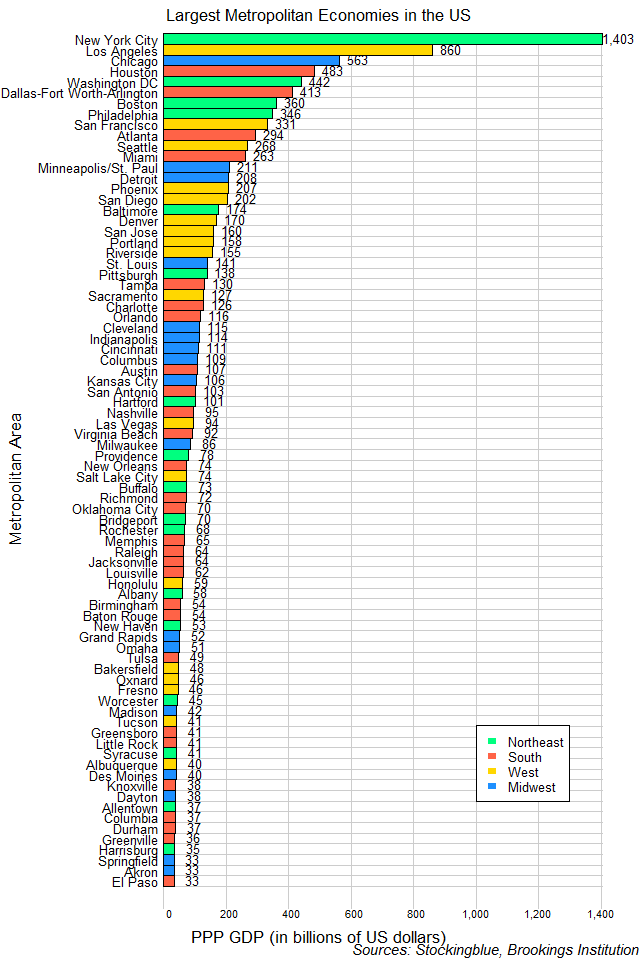
The chart above shows the largest metropolitan economies in the United States that happen to also be among the world's largest 300 metropolitan economies based on the Brookings Institution. Each region of the US has a city in the top four.
The Largest Metropolitan Economies in the EU
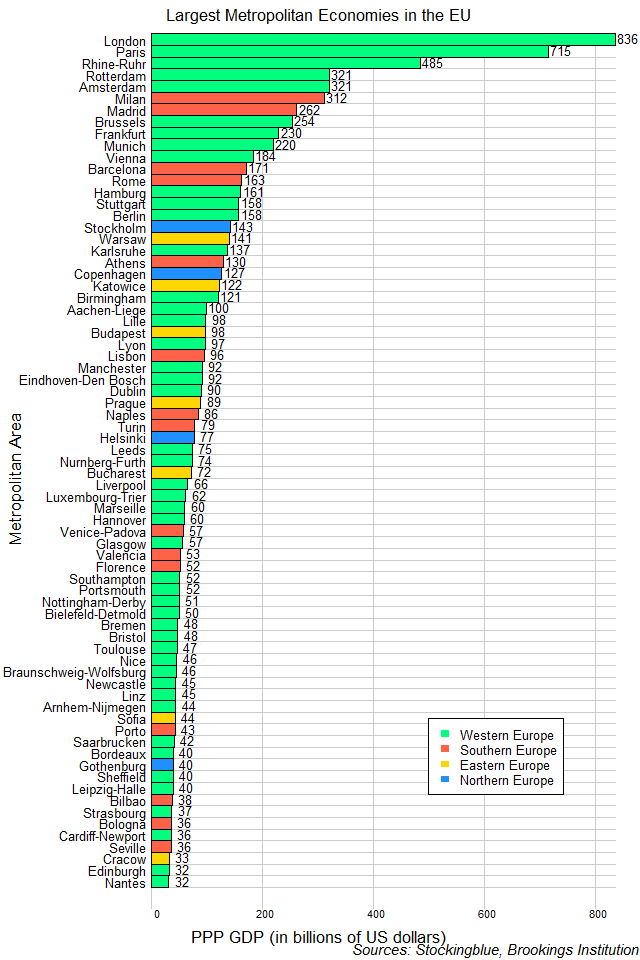
The chart above shows the largest metropolitan economies in the European Union that happen to also be among the world's largest 300 metropolitan economies based on the Brookings Institution. Western Europe dominates in both the number of large economies and the size of each.
The United States' Borders Based on Gross Domestic Product
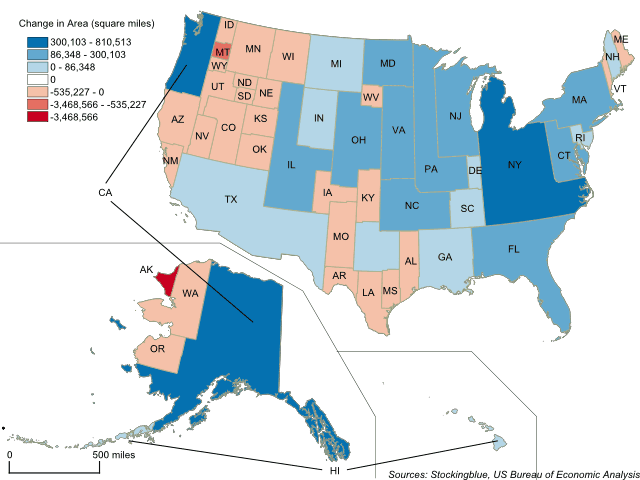
The geographically accurate cartogram above represents the states' boundaries based on gross domestic product. California, New York, and Texas take up large swaths of the country while Alaska nearly loses all of its territory.
The Arabian Peninsula's Borders Based on Gross Domestic Product
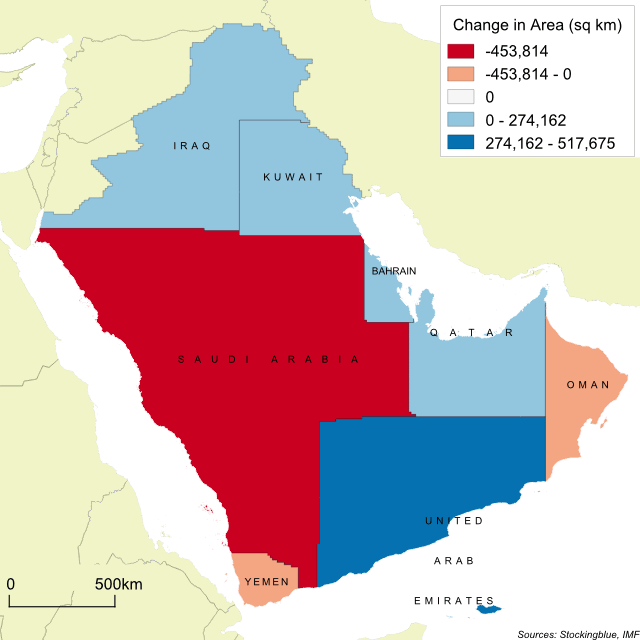
This week, the focus is on the Arabian Peninsula as recent events there are causing global concern. The geographically accurate cartogram above represents the nations in the region based on gross domestic product.
GDP and GDP Per Capita Growth between 2005 and 2016 in the European Union and the United States
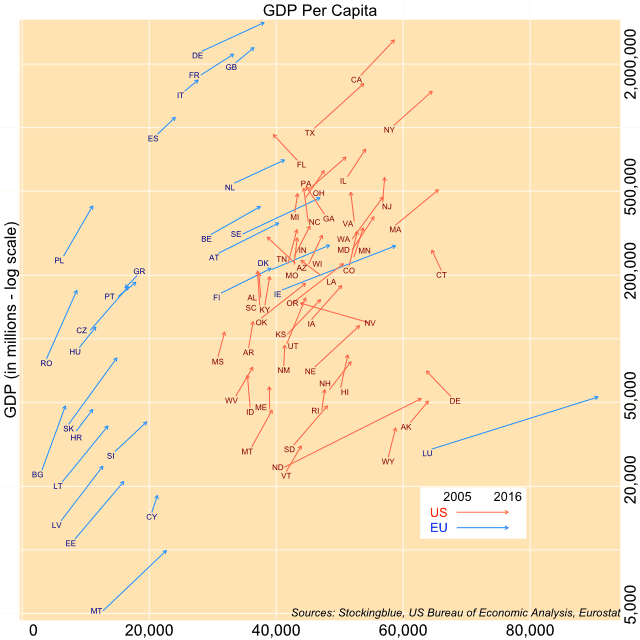
The chart above shows both the change in overall GDP (y-axis) and per capita GDP (x-axis) over a period of 11 years for EU and US states. All states except for one have experienced growth from 2005 to 2016. However, several states saw their per capita GDP decrease.
Gross Domestic Product by Arable Land Worldwide
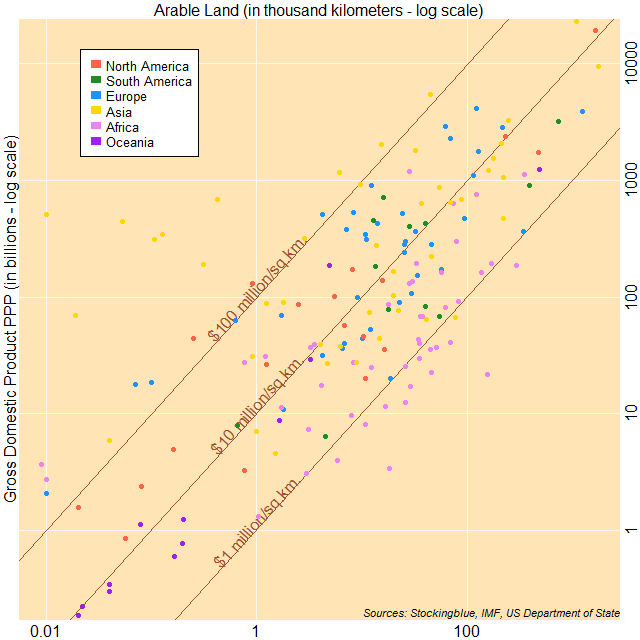
The chart above shows economic output as it relates to arable land. The countries to the top left have a larger ratio of gross domestic product (GDP) to arable land, while countries to the bottom right have a smaller ratio of GDP to arable land. Asia has the countries that have the largest ratio of GDP to area whereas Africa has the countries that have the smallest ratio of GDP to area.
Gross Domestic Product by Arable Land in Oceania
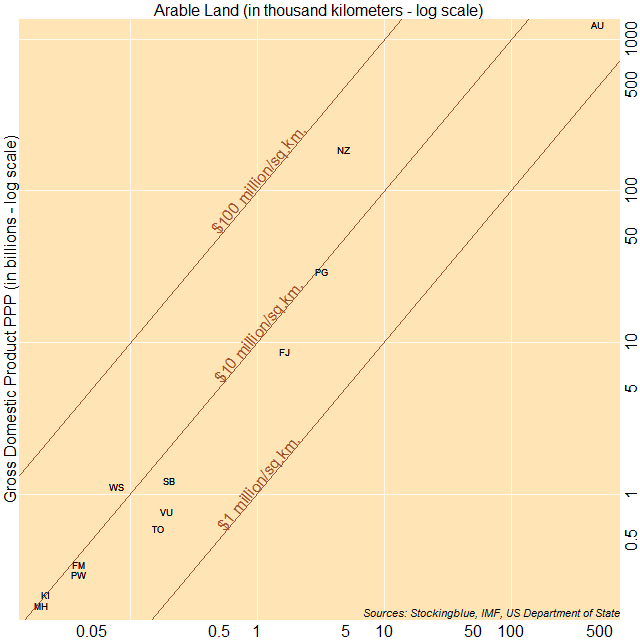
The chart above shows economic output as it relates to arable land. The countries to the top left have a larger ratio of gross domestic product (GDP) to arable land, while countries to the bottom right have a smaller ratio of GDP to arable land. New Zealand, Samoa, and Kiribati have the largest ratio of GDP to area whereas Australia, Tonga, and Vanuatu have the smallest ratio of GDP to area.
Gross Domestic Product by Arable Land in Africa
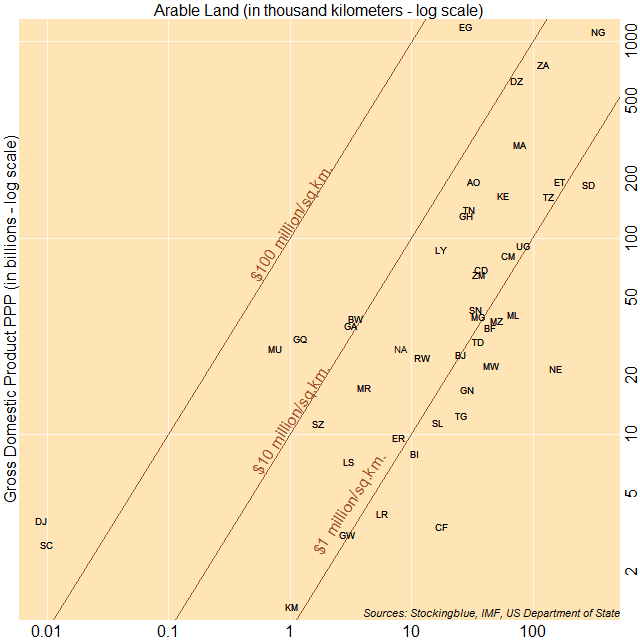
The chart above shows economic output as it relates to arable land. The countries to the top left have a larger ratio of gross domestic product (GDP) to arable land, while countries to the bottom right have a smaller ratio of GDP to arable land. Singapore, Hong Kong, and Bahrain have the largest ratio of GDP to area whereas Afghanistan, Cambodia, and Kazakhstan have the smallest ratio of GDP to area.
OlderNewer