Long-Term GDP by EU and US Region, Third Quarter 2020
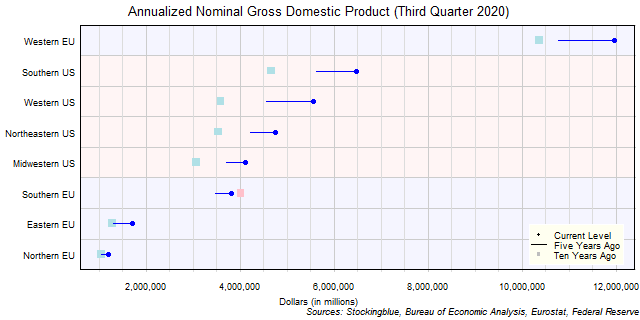
The chart above shows the annualized nominal gross domestic product (GDP) in each EU and US region as of the third quarter of 2020 in millions of US dollars, the change from five years ago, and the GDP ten years prior. The Southern EU is the only region to witness a decline in GDP over the ten year period.
Long-Term GDP by EU Region, Third Quarter 2020

The chart above shows the annualized nominal gross domestic product (GDP) in each EU region as of the third quarter of 2020 in millions of euros, the change from five years ago, and the GDP ten years prior. Every single region's economy grew both over the past five and ten years.
Long-Term GDP by US Region, Third Quarter 2020

The chart above shows the annualized nominal gross domestic product (GDP) in each US region as of the third quarter of 2020 in millions of dollars, the change from five years ago, and the GDP ten years prior. Every single region's economy grew both over the past five and ten years.
Long-Term GDP by EU and US State, Third Quarter 2020
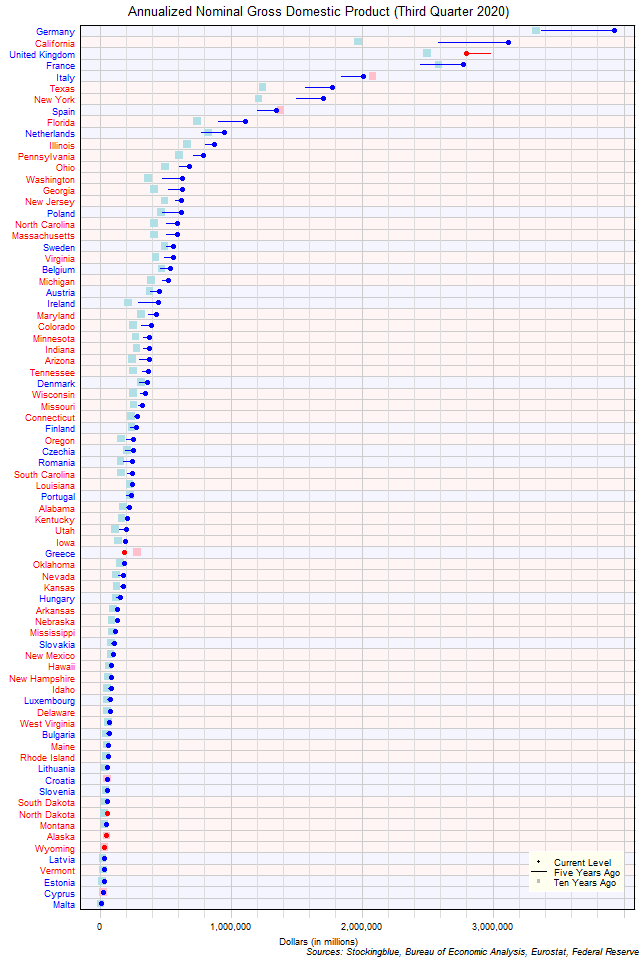
The chart above shows the annualized nominal gross domestic product (GDP) in each EU and US state as of the third quarter of 2020 in millions of US dollars, the change from five years ago, and the GDP ten years prior. Germany continues to be the largest economy but California is hot on its tail.
Long-Term GDP by EU State, Third Quarter 2020
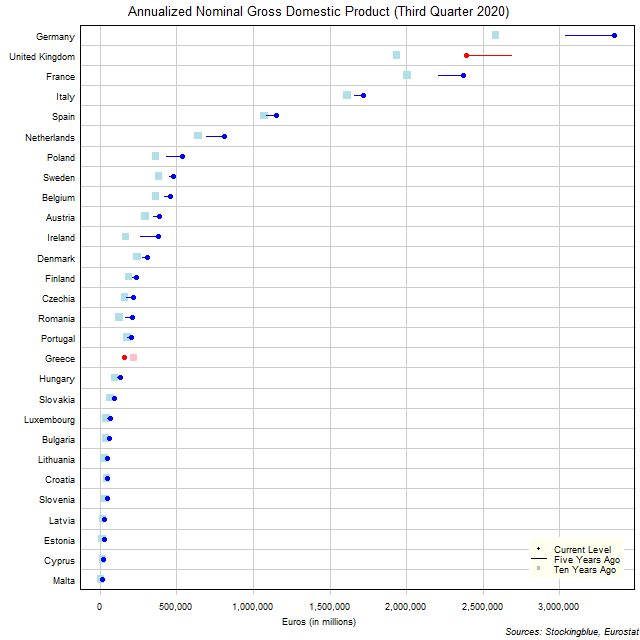
The chart above shows the annualized nominal gross domestic product (GDP) in each EU state as of the third quarter of 2020 in millions of euros, the change from five years ago, and the GDP ten years prior. Germany's economy grew more over the past five years than 18 states' entire GDP.
Long-Term GDP by US State, Third Quarter 2020
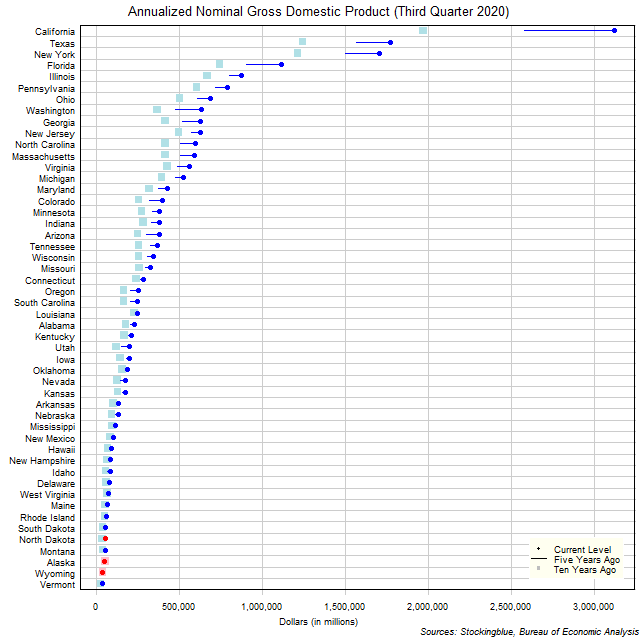
The chart above shows the annualized nominal gross domestic product (GDP) in each US state as of the third quarter of 2020 in millions of dollars, the change from five years ago, and the GDP ten years prior. California's economy grew more over the past five years than the size of 42 states' entire economies.
EU and US GDP Growth Rate by Region, Third Quarter 2020
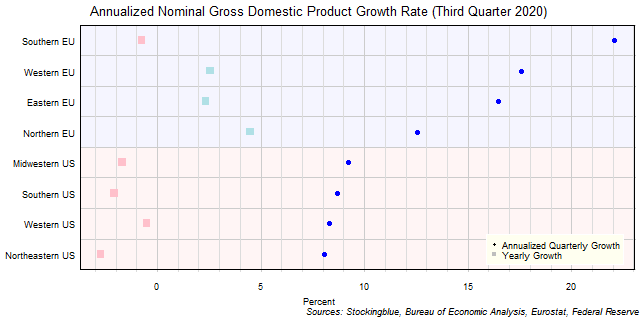
The chart above shows the annualized nominal gross domestic product (GDP) quarterly growth rate in each EU and US region as of the third quarter of 2020 and the growth rate from one year prior. Every single region's economy grew over the previous quarter.
EU GDP Growth Rate by Region, Third Quarter 2020

The chart above shows the annualized nominal gross domestic product (GDP) quarterly growth rate in each EU region as of the third quarter of 2020 and the growth rate from one year prior. Every single region's economy grew over the previous quarter.
US GDP Growth Rate by Region, Third Quarter 2020

The chart above shows the annualized nominal gross domestic product (GDP) quarterly growth rate in each US region as of the third quarter of 2020 and the growth rate from one year prior. Every single region's economy grew over the previous quarter.
EU and US GDP Growth Rate by State, Third Quarter 2020
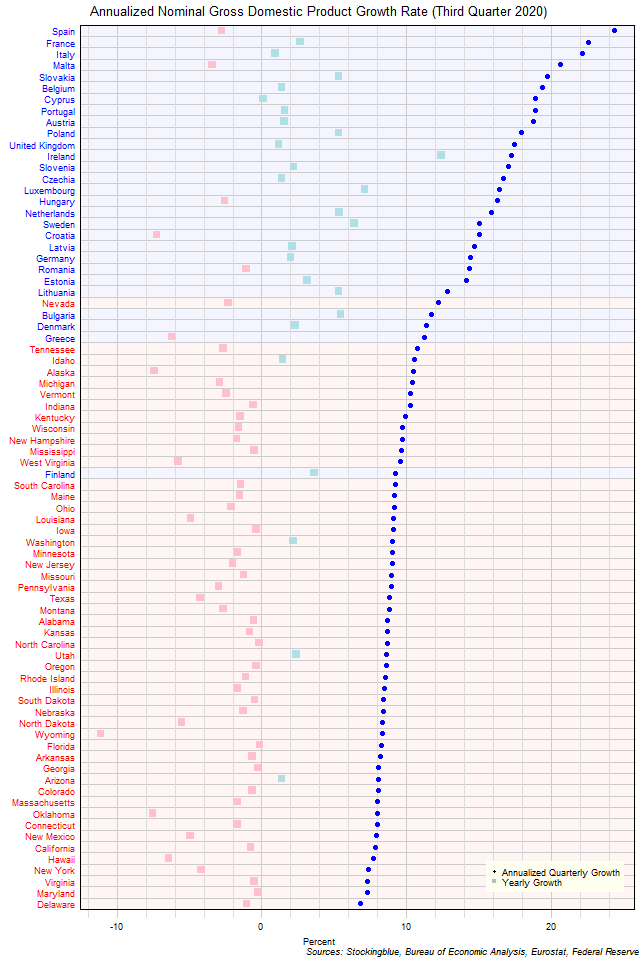
The chart above shows the annualized nominal gross domestic product (GDP) quarterly growth rate when the GDP is priced in US dollars in each EU and US state as of the third quarter of 2020 and the growth rate from one year prior. Every single state's economy grew over the previous quarter.
OlderNewer