Per Capita GDP by US Region, Second Quarter 2020

The chart above shows the per capita annualized nominal gross domestic product (GDP) in each US region as of the second quarter of 2020 in dollars, the change from the previous quarter, and the per capita GDP one year prior. Every single region's economy contracted over the past quarter and over the past year.
Per Capita GDP by EU and US State, Second Quarter 2020
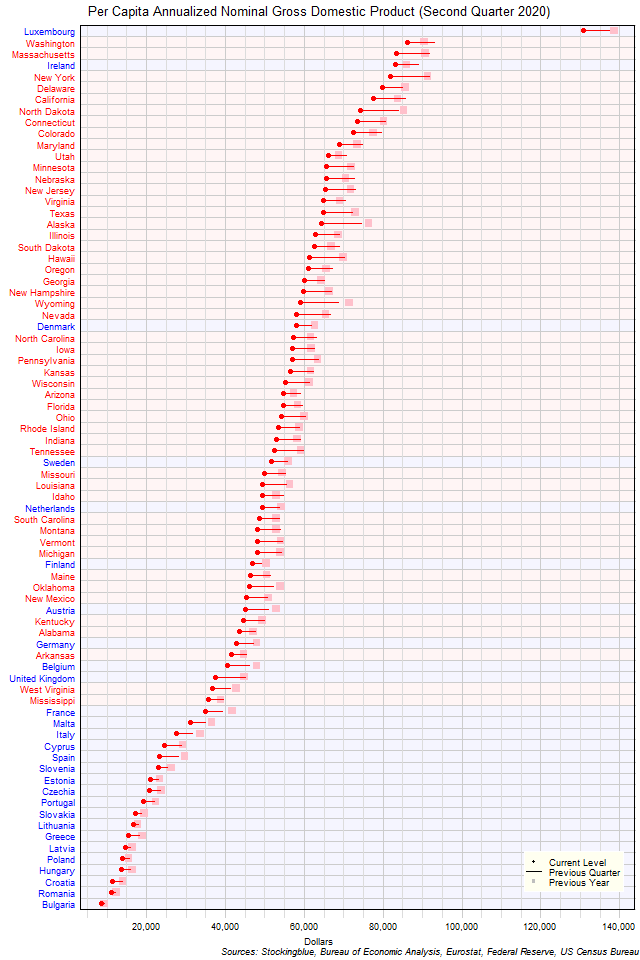
The chart above shows the per capita annualized nominal gross domestic product (GDP) in each EU and US state as of the second quarter of 2020 in dollars, the change from the previous quarter, and the GDP one year prior. Every single state's per capita GDP contracted over the past quarter and the past year.
Per Capita GDP by EU State, Second Quarter 2020
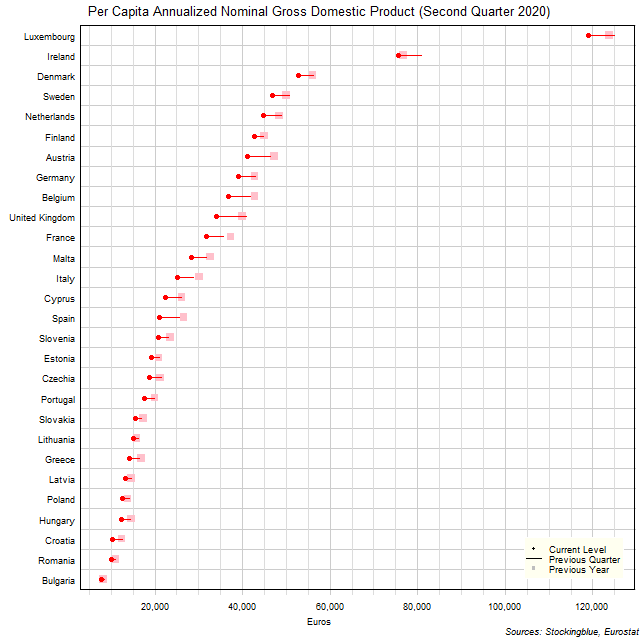
The chart above shows the per capita annualized nominal gross domestic product (GDP) in each EU state as of the second quarter of 2020 in euros, the change from the previous quarter, and the GDP one year prior. Every single state's economy contracted over the past quarter and the past year.
Per Capita GDP by US State, Second Quarter 2020
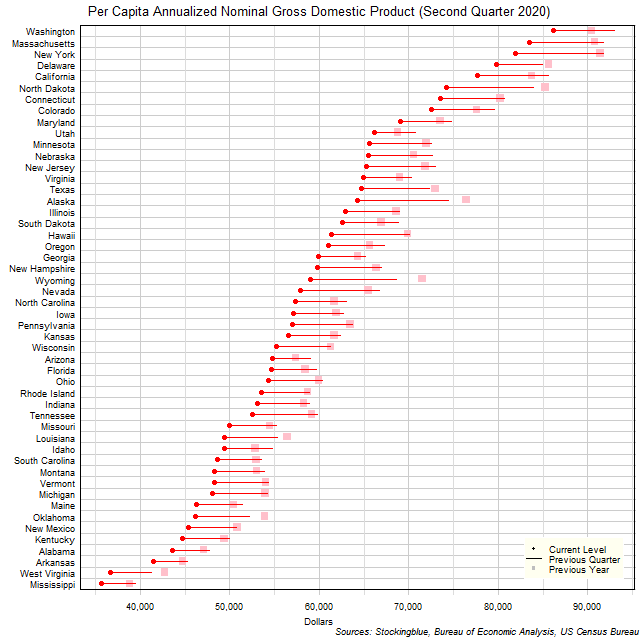
The chart above shows the per capita annualized nominal gross domestic product (GDP) in each US state as of the second quarter of 2020 in dollars, the change from the previous quarter, and the GDP one year prior. Every single state's economy contracted over the past quarter and the past year.
EU and US GDP by Region, Second Quarter 2020
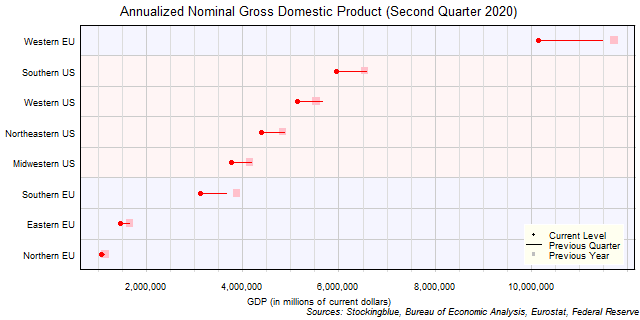
The chart above shows the annualized nominal gross domestic product (GDP) in each EU and US region as of the second quarter of 2020 in millions of dollars, the change from the previous quarter, and the GDP one year prior. Every single region's economy contracted over the past quarter and the past year.
EU GDP by Region, Second Quarter 2020

The chart above shows the annualized nominal gross domestic product (GDP) in each EU region as of the second quarter of 2020 in millions of euros, the change from the previous quarter, and the GDP one year prior. Every single region's economy contracted over the past quarter and the past year.
US GDP by Region, Second Quarter 2020

The chart above shows the annualized nominal gross domestic product (GDP) in each US region as of the second quarter of 2020 in millions of dollars, the change from the previous quarter, and the GDP one year prior. Every single region's economy contracted over the past quarter and the past year.
EU and US GDP by State, Second Quarter 2020
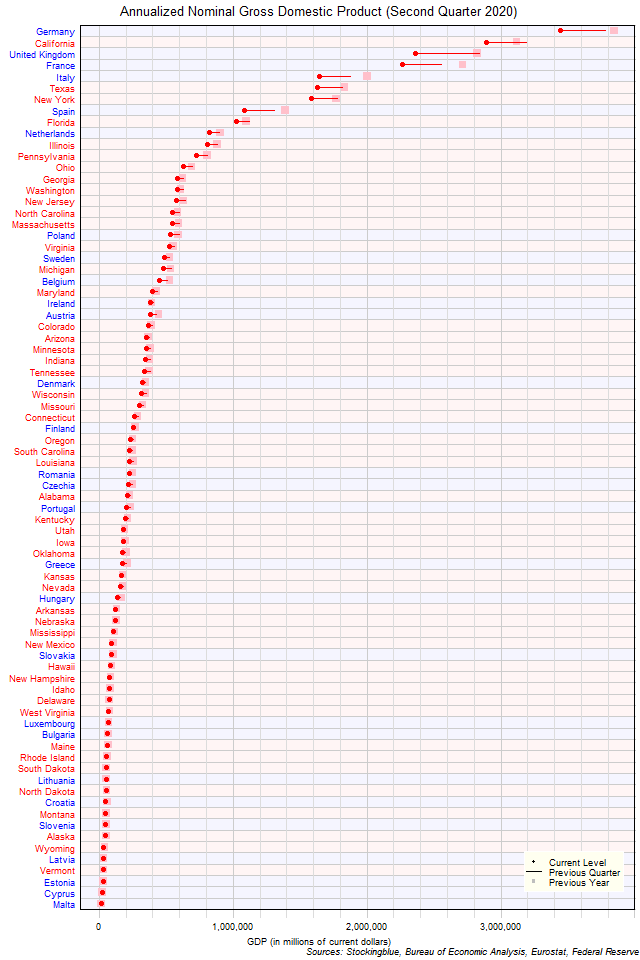
The chart above shows the annualized nominal gross domestic product (GDP) in each EU and US state as of the second quarter of 2020 in millions of US dollars, the change from the previous quarter, and the GDP one year prior. Every single state had a decrease in GDP over the previous quarter and over the previous year.
EU GDP by State, Second Quarter 2020
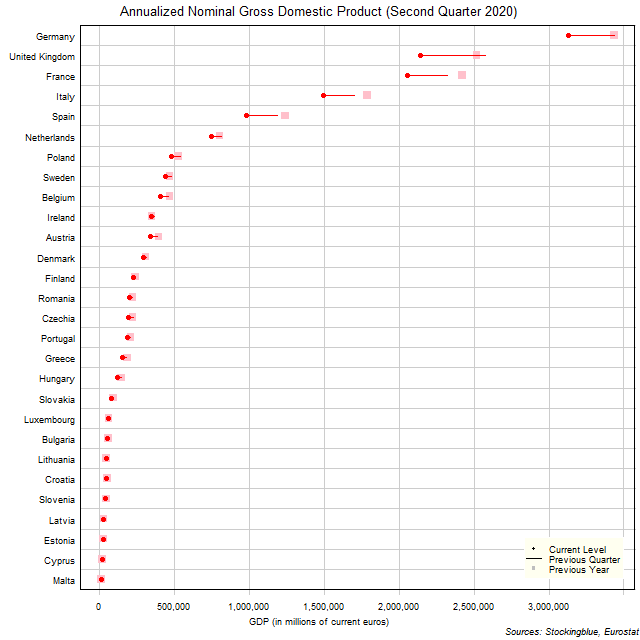
The chart above shows the annualized nominal gross domestic product (GDP) in each EU state as of the second quarter of 2020 in millions of euros, the change from the previous quarter, and the GDP one year prior. Every single state had a decrease in GDP over the previous quarter and over the previous year.
US GDP by State, Second Quarter 2020
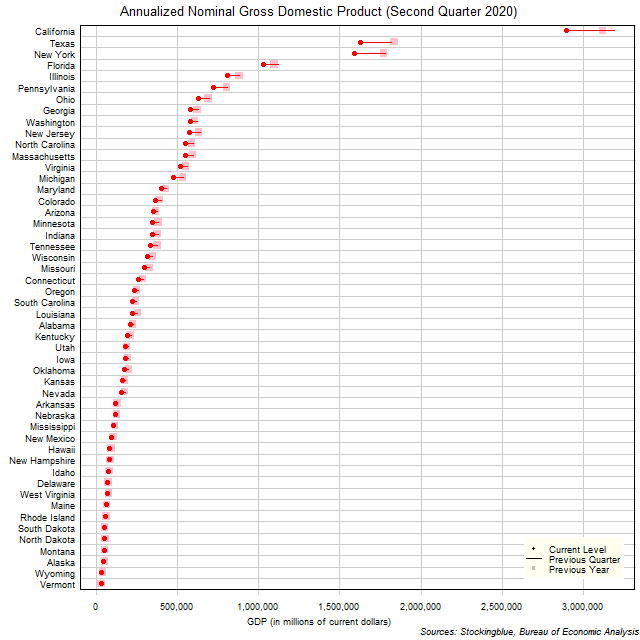
The chart above shows the annualized nominal gross domestic product (GDP) in each US state as of the second quarter of 2020 in millions of dollars, the change from the previous quarter, and the GDP one year prior. Every single state had a decrease in GDP over the previous quarter and over the previous year.
OlderNewer