US GDP Growth Rate by Region, First Quarter 2020

The chart above shows the annualized nominal gross domestic product (GDP) quarterly growth rate in each US region as of the first quarter of 2020 and the growth rate from one year prior. Every single region's economy shrank over the past quarter and grew over the past year.
EU and US GDP Growth Rate by State, First Quarter 2020
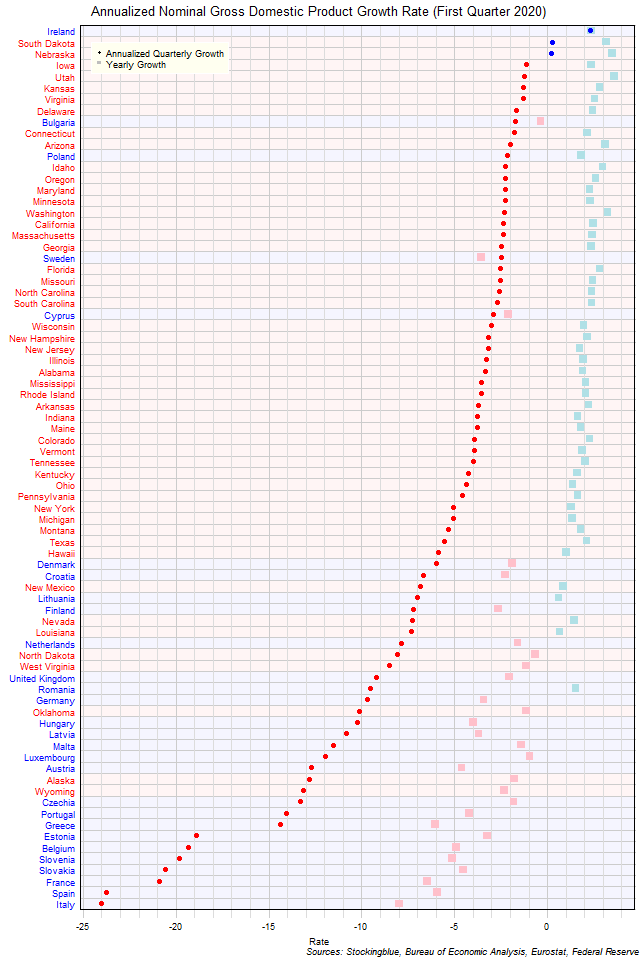
The chart above shows the annualized nominal gross domestic product (GDP) quarterly growth rate when the GDP is priced in US dollars in each EU and US state as of the first quarter of 2020 and the growth rate from one year prior. Ireland, South Dakota, and Nebraska were the only three states to have positive growth over the previous quarter.
EU GDP Growth Rate by State, First Quarter 2020
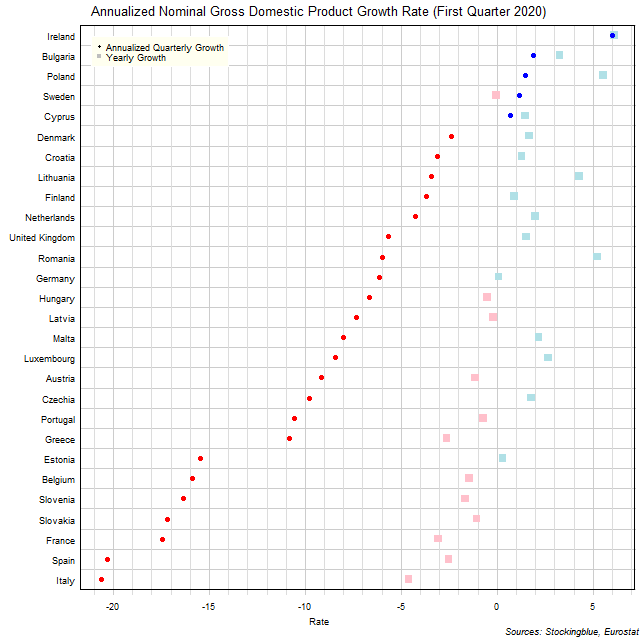
The chart above shows the annualized nominal gross domestic product (GDP) quarterly growth rate in each EU state as of the first quarter of 2020 and the growth rate from one year prior. Ireland, Bulgaria, Poland, Sweden, and Cyprus were the only states to see an economic expansion over the previous quarter.
US GDP Growth Rate by State, First Quarter 2020
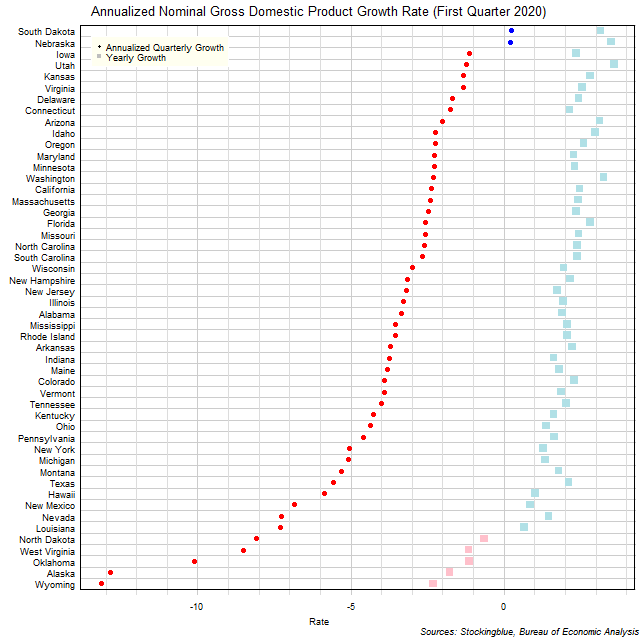
The chart above shows the annualized nominal gross domestic product (GDP) quarterly growth rate in each US state as of the first quarter of 2020 and the growth rate from one year prior. South Dakota and Nebraska are the only states to see an economic expansion over the previous quarter.
Per Capita GDP by EU and US Region, First Quarter 2020
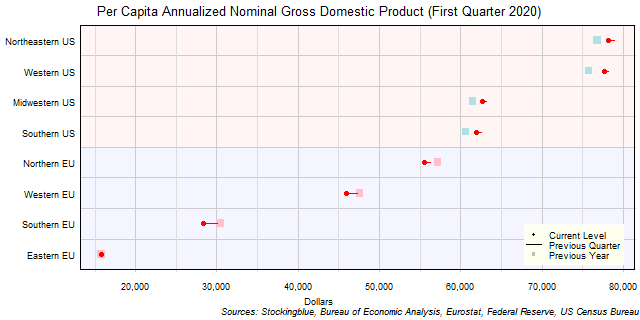
The chart above shows the per capita annualized nominal gross domestic product (GDP) in each EU and US region as of the first quarter of 2020 in US dollars, the change from the previous quarter, and the per capita GDP one year prior. All eight regions had negative growth in per capita GDP over the previous quarter.
Per Capita GDP by EU Region, First Quarter 2020

The chart above shows the per capita annualized nominal gross domestic product (GDP) in each EU region as of the first quarter of 2020 in euros, the change from the previous quarter, and the per capita GDP one year prior. The Northern and Eastern EU were the only two regions to grow over the past year.
Per Capita GDP by US Region, First Quarter 2020

The chart above shows the per capita annualized nominal gross domestic product (GDP) in each US region as of the first quarter of 2020 in dollars, the change from the previous quarter, and the per capita GDP one year prior. Every single region's economy shrank over the past quarter and grew over the past year.
Per Capita GDP by EU and US State, First Quarter 2020
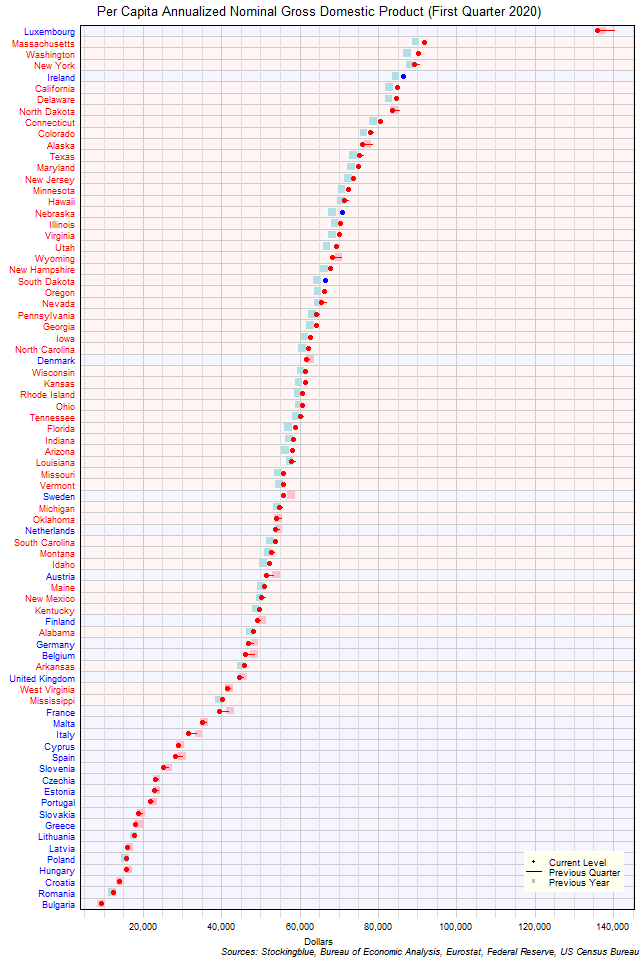
The chart above shows the per capita annualized nominal gross domestic product (GDP) in each EU and US state as of the first quarter of 2020 in dollars, the change from the previous quarter, and the GDP one year prior. Luxembourg is in a class all by itself.
Per Capita GDP by EU State, First Quarter 2020
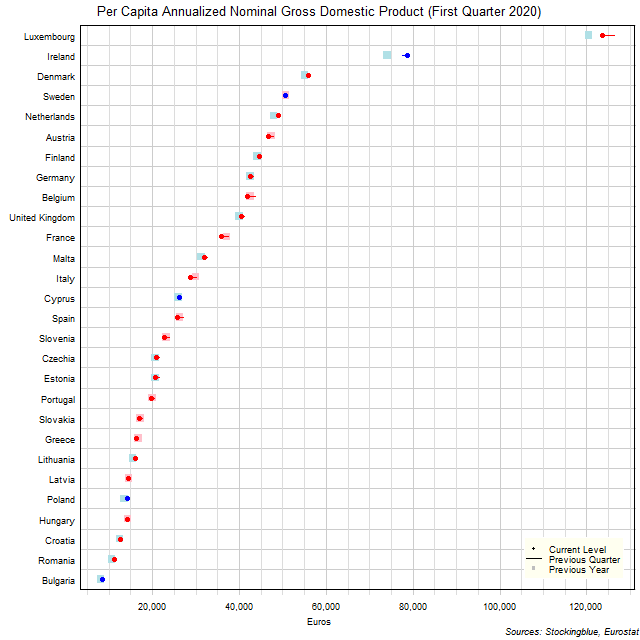
The chart above shows the per capita annualized nominal gross domestic product (GDP) in each EU state as of the first quarter of 2020 in euros, the change from the previous quarter, and the GDP one year prior. Bulgaria, Cyprus, Ireland, and Poland were the only states to see a gain in per capita GDP both over the previous quarter and over the previous year.
Per Capita GDP by US State, First Quarter 2020
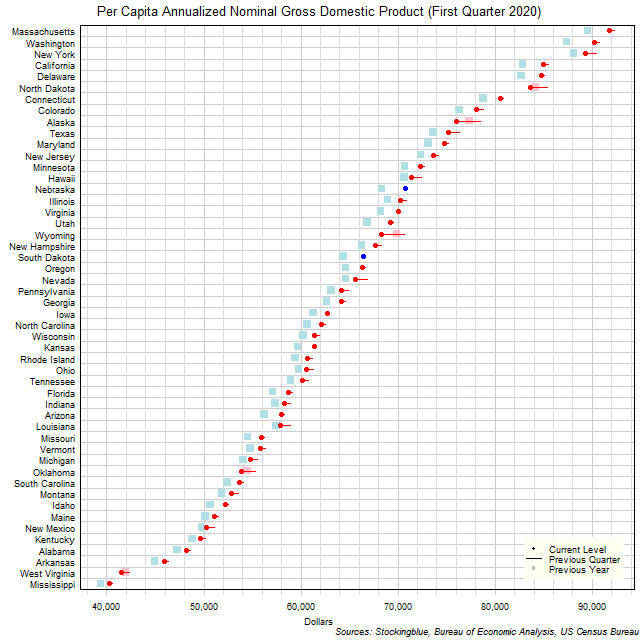
The chart above shows the per capita annualized nominal gross domestic product (GDP) in each US state as of the first quarter of 2020 in dollars, the change from the previous quarter, and the GDP one year prior. Nebraska and South Dakota were the only states to experience a gain in per capita GDP over the past quarter.
OlderNewer