The Correlation between GDP PPP Per Capita and GDP PPP Per Area in Asia
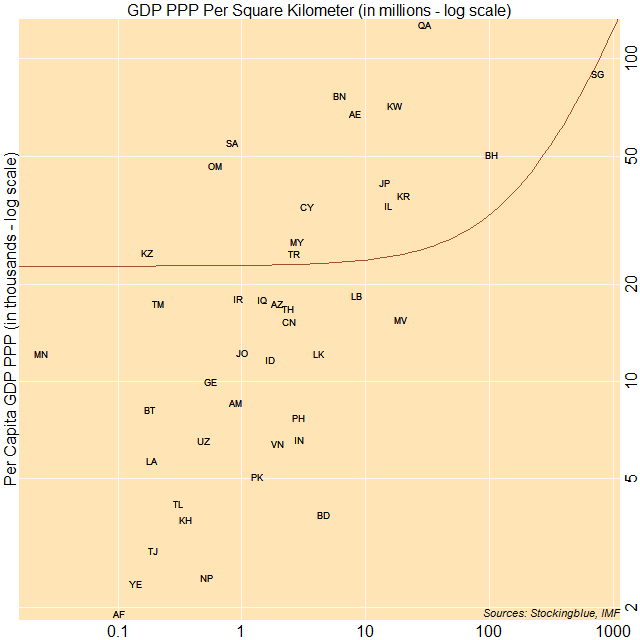
The correlation between per capita gross domestic product based on purchasing power parity (GDP PPP) and GDP PPP per area in Asia is moderate. The three largest economies on a per capita basis have either a moderate or high per area GDP relative to other countries on the continent.
The Correlation between GDP PPP Per Capita and GDP PPP Per Area in Europe
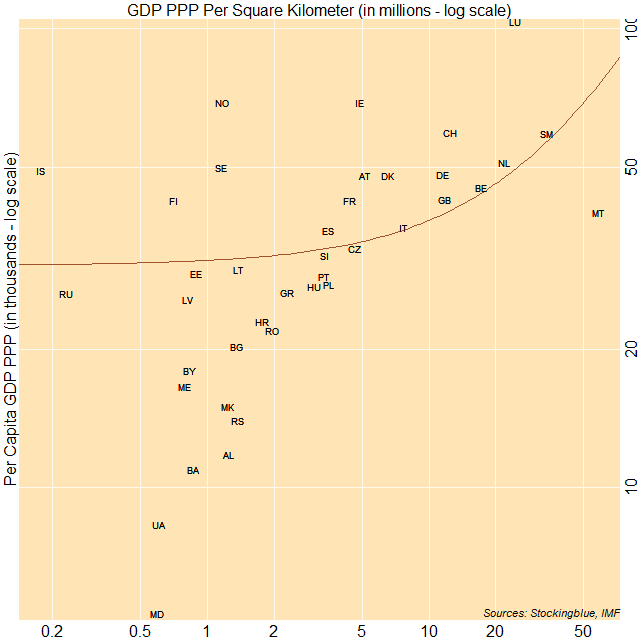
The correlation between per capita gross domestic product based on purchasing power parity (GDP PPP) and GDP PPP per area in Europe is moderate. The three largest economies on a per capita basis have either a low, moderate, or high per area GDP relative to other countries on the continent.
The Correlation between GDP PPP Per Capita and GDP PPP Per Area in South America
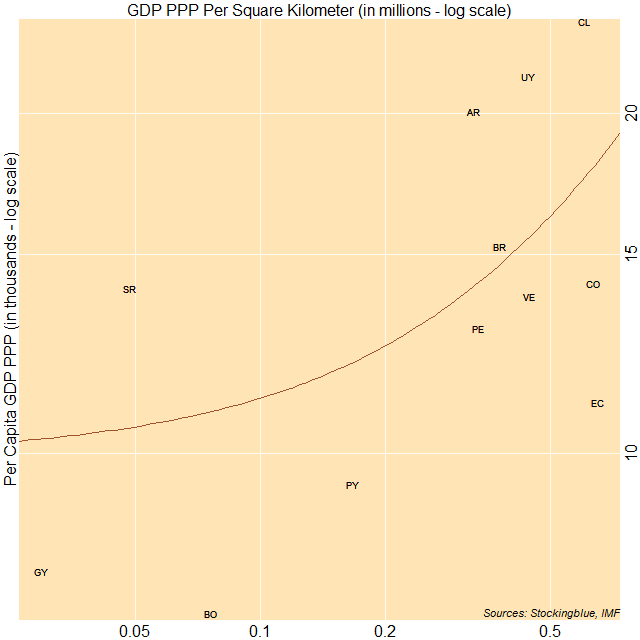
The correlation between per capita gross domestic product based on purchasing power parity (GDP PPP) and GDP PPP per area in South America is moderately strong. The three largest economies on a per capita basis have either a moderate or high per area GDP relative to other countries on the continent.
The Correlation between GDP PPP Per Capita and GDP PPP Per Area in North America
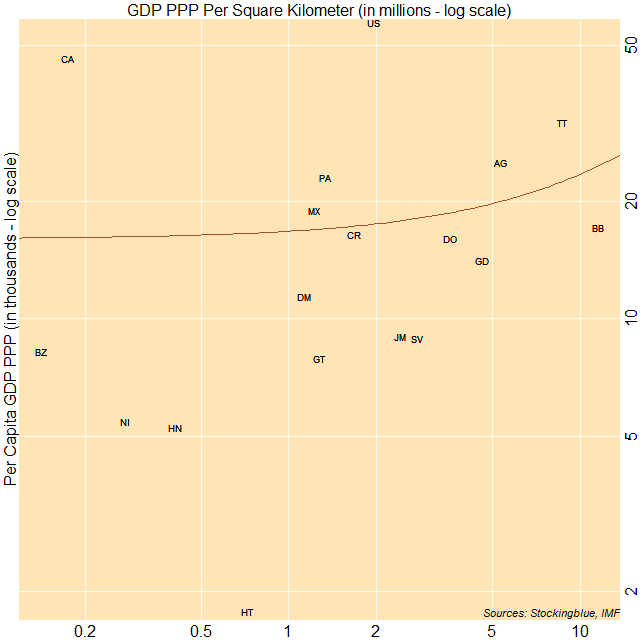
The correlation between per capita gross domestic product based on purchasing power parity (GDP PPP) and GDP PPP per area in North America is almost nonexistent. The three largest economies on a per capita basis have either a very low, moderate, or high per area GDP.
Gross Domestic Product by Arable Land Worldwide
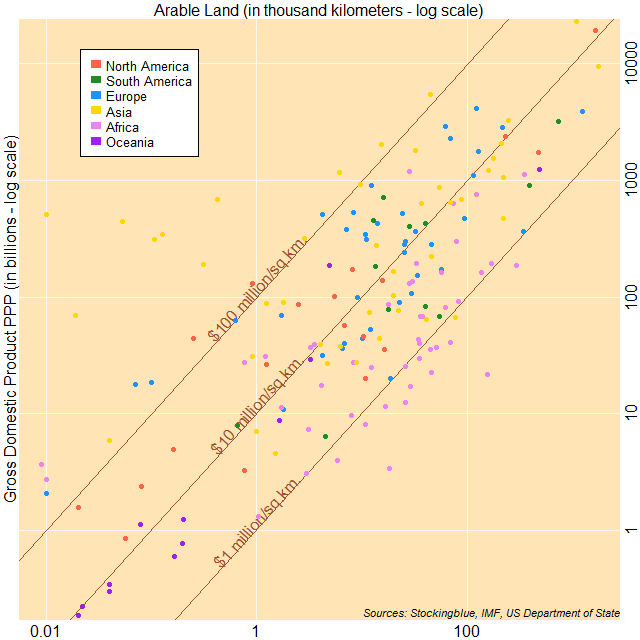
The chart above shows economic output as it relates to arable land. The countries to the top left have a larger ratio of gross domestic product (GDP) to arable land, while countries to the bottom right have a smaller ratio of GDP to arable land. Asia has the countries that have the largest ratio of GDP to area whereas Africa has the countries that have the smallest ratio of GDP to area.
Gross Domestic Product by Arable Land in Oceania
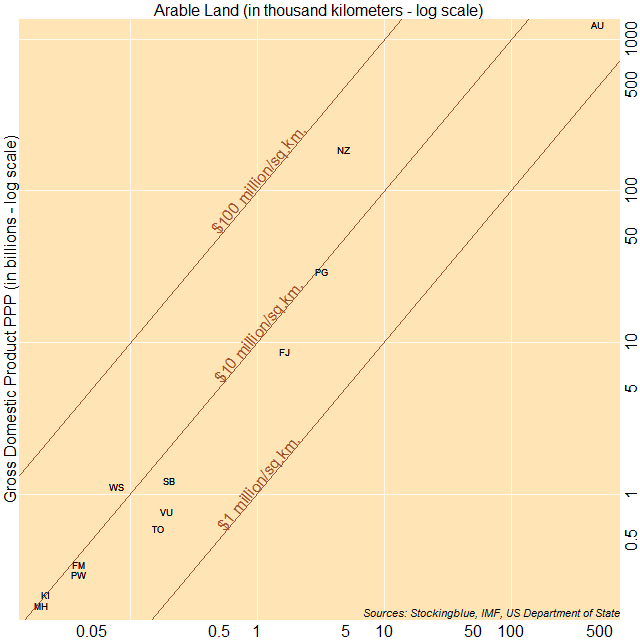
The chart above shows economic output as it relates to arable land. The countries to the top left have a larger ratio of gross domestic product (GDP) to arable land, while countries to the bottom right have a smaller ratio of GDP to arable land. New Zealand, Samoa, and Kiribati have the largest ratio of GDP to area whereas Australia, Tonga, and Vanuatu have the smallest ratio of GDP to area.
Gross Domestic Product by Arable Land in Africa
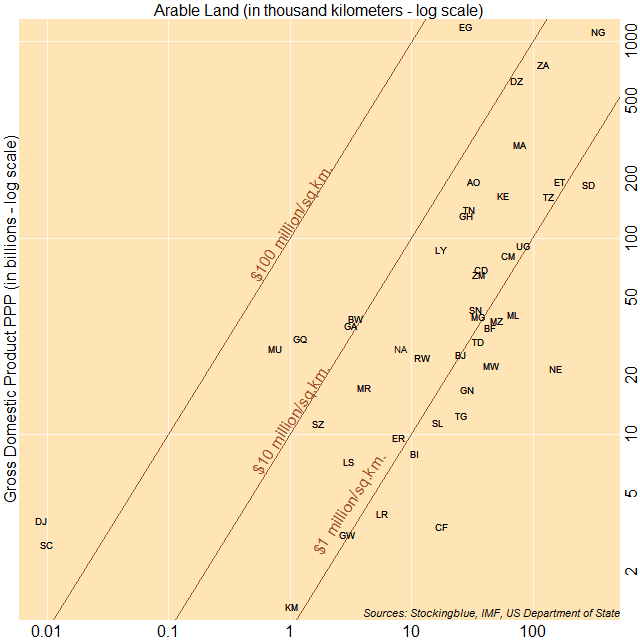
The chart above shows economic output as it relates to arable land. The countries to the top left have a larger ratio of gross domestic product (GDP) to arable land, while countries to the bottom right have a smaller ratio of GDP to arable land. Singapore, Hong Kong, and Bahrain have the largest ratio of GDP to area whereas Afghanistan, Cambodia, and Kazakhstan have the smallest ratio of GDP to area.
Gross Domestic Product by Arable Land in Asia
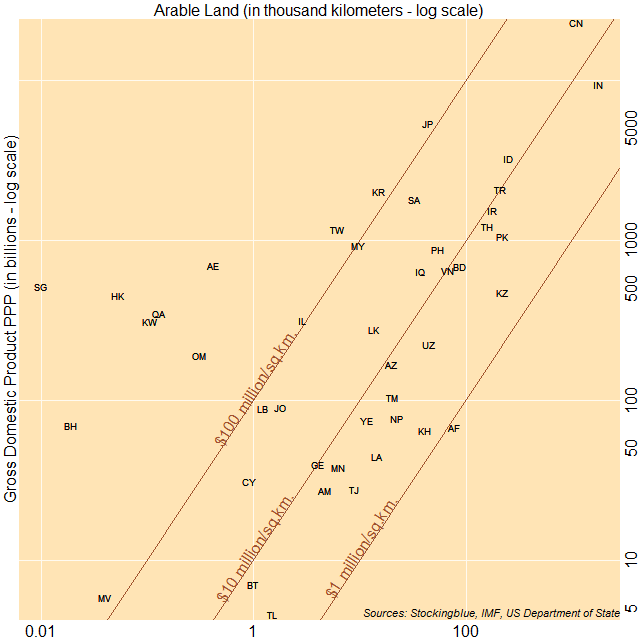
The chart above shows economic output as it relates to arable land. The countries to the top left have a larger ratio of gross domestic product (GDP) to arable land, while countries to the bottom right have a smaller ratio of GDP to arable land. Singapore, Hong Kong, and Bahrain have the largest ratio of GDP to area whereas Afghanistan, Cambodia, and Kazakhstan have the smallest ratio of GDP to area.
Gross Domestic Product by Arable Land in Europe
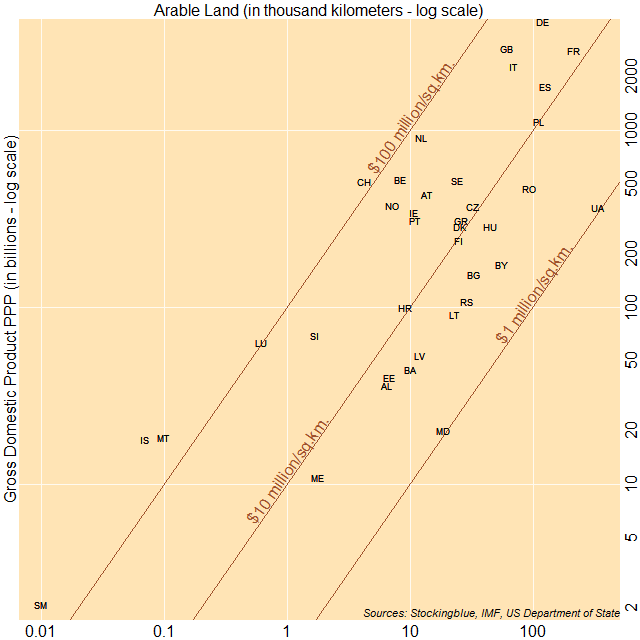
The chart above shows economic output as it relates to arable land. The countries to the top left have a larger ratio of gross domestic product (GDP) to arable land, while countries to the bottom right have a smaller ratio of GDP to arable land. Iceland, San Marino, and Malta have the largest ratio of GDP to area whereas Moldova, Ukraine, and Belarus have the smallest ratio of GDP to area.
Gross Domestic Product by Arable Land in South America
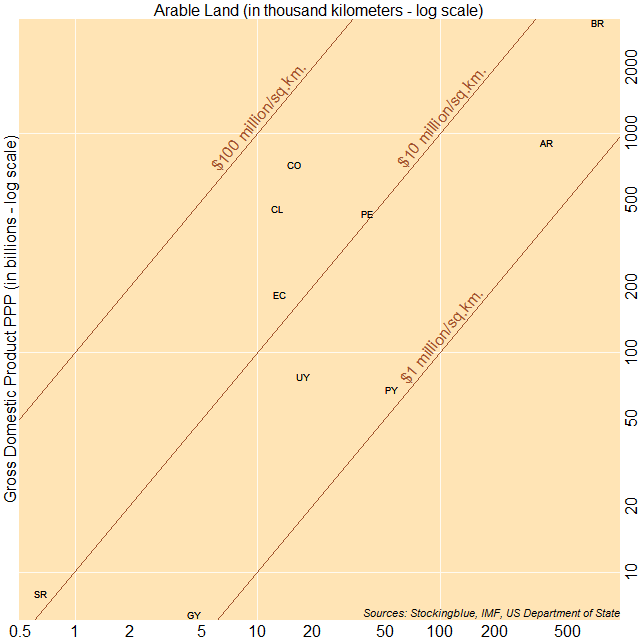
The chart above shows economic output as it relates to arable land. The countries to the top left have a larger ratio of gross domestic product (GDP) to arable land, while countries to the bottom right have a smaller ratio of GDP to arable land. Colombia, Chile, and Ecuador have the largest ratio of GDP to area whereas Argentina, Paraguay, and Guyana have the smallest ratio of GDP to area.
OlderNewer