Busy Commercial Airports per Million People in EU States
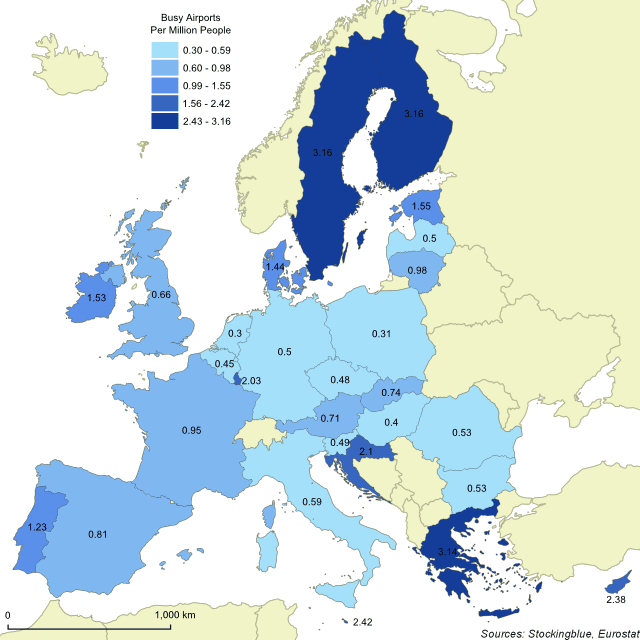
The map above shows the number of airports that serve at least 15,000 passengers per year for every million residents in each EU state. Sweden has the most busy airports per capita.
Busy Commercial Airports per Million International Tourists in the US
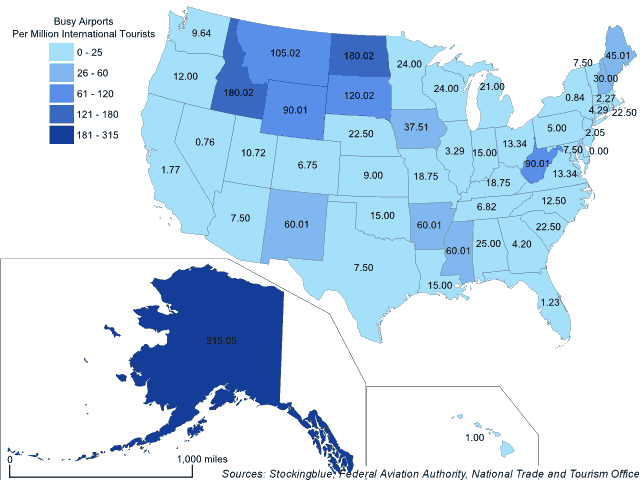
The map above shows the number of airports that serve at least 15,000 passengers per year for every million international tourists each US state receives. Alaska has the most airports for every million international tourists by a large margin.
Busy Commercial Airports per Million International Tourists in the EU
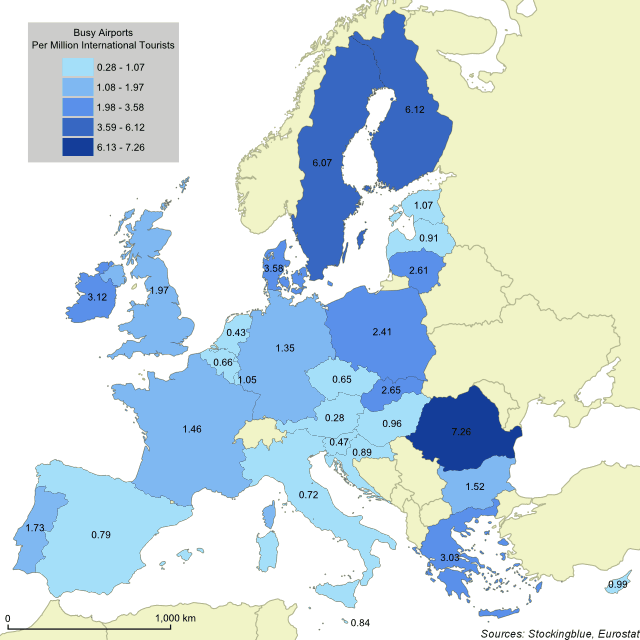
The map above shows the number of airports that serve at least 15,000 passengers per year for every million international tourists each EU state receives. Romania has the most airports for every million tourists.
Busy Commercial Airports in the United States
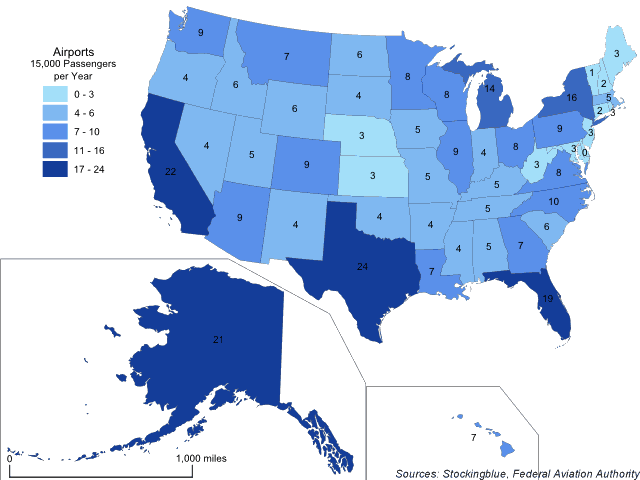
The map above shows the number of airports in each US state that serve at least 15,000 passengers per year. Texas leads all other US states and beats California by a slim margin.
Busy Commercial Airports in the European Union
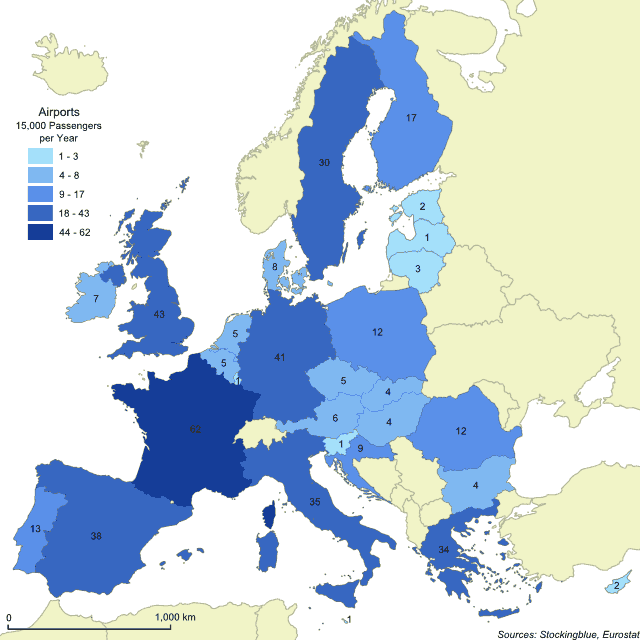
The map above shows the number of airports in each EU state that serve at least 15,000 passengers per year. France leads all other EU states by a large margin, even ones with a similar geography to hers.
Grape Production in the United States
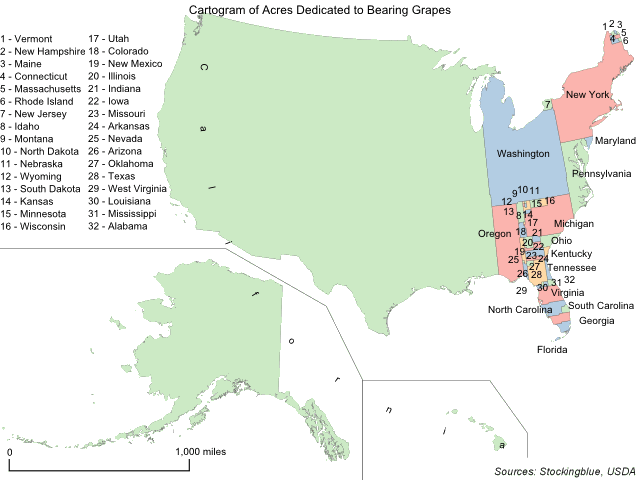
This week, like last year, the focus is on common Thanksgiving foods and which states produce them. The geographically accurate cartogram above redraws the states' sizes based on grape production. Specifically the number of acres dedicated to bearing the fruit. All states except for one, Alaska, produce grapes and of the 49, the USDA publishes complete data on only 47 of them due to the other two states having few producers which would make it easy for their competitors to know how large their operations are.
Apple Production in the United States
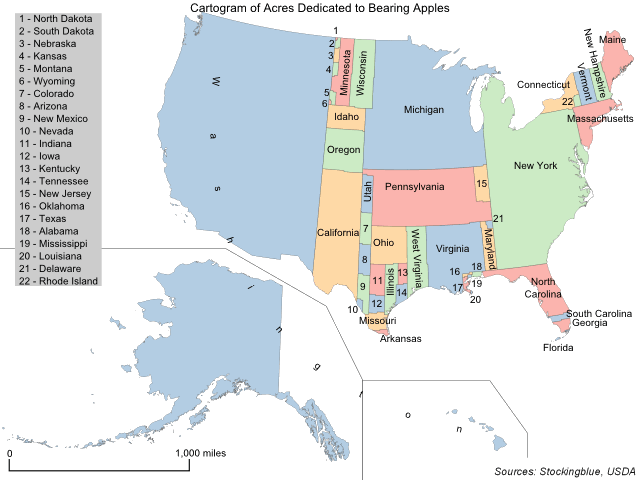
This week, like last year, the focus is on common Thanksgiving foods and which states produce them. The geographically accurate cartogram above redraws the states' sizes based on apple production. Specifically the number of acres dedicated to bearing the fruit. All 50 states produce apples and of the 50, the USDA publishes complete data on only 48 of them due to the other two states having few producers which would make it easy for their competitors to know how large their operations are.
Carrot Production in the United States
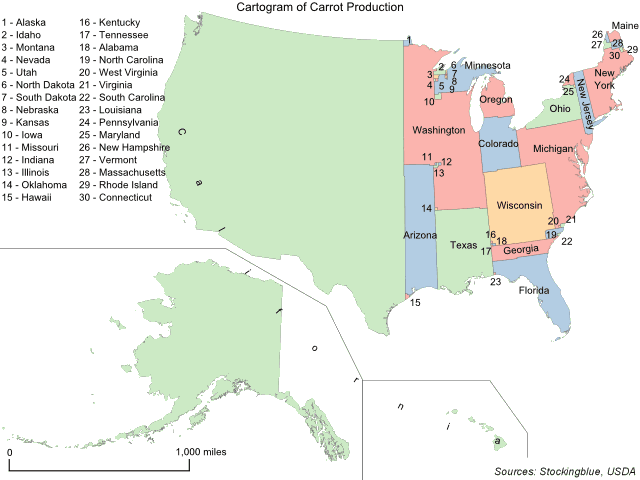
This week, like last year, the focus is on common Thanksgiving foods and which states produce them. The geographically accurate cartogram above redraws the states' sizes based on carrot production. Specifically the number of acres harvested. All 50 states produce the vegetable and of the 50, the USDA publishes complete data on only 45 of them due to the other five states either having few producers which would make it easy for their competitors to know how large their operations are or a very small number of acres harvested.
Brussels Sprout Production in the United States
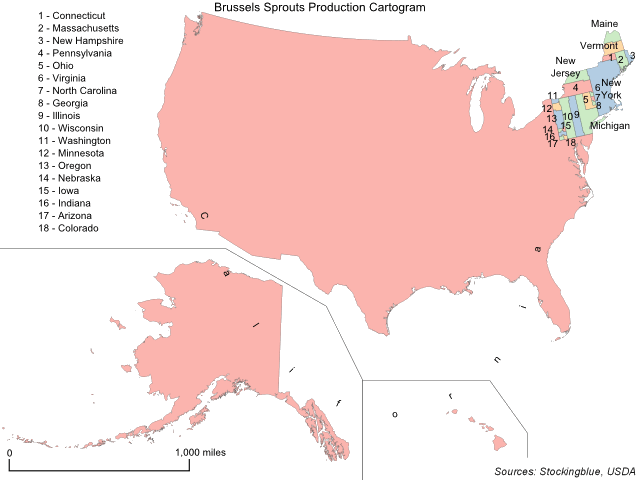
This week, like last year, the focus is on common Thanksgiving foods and which states produce them. The geographically accurate cartogram above redraws the states' sizes based on Brussels sprout production. Specifically the number of acres harvested. Only 32 states produce the vegetable and of the 32, the USDA publishes complete data on only 24 of them due to the other eight states either having few producers which would make it easy for their competitors to know how large their operations are or a very small number of acres harvested.
Pecan Production in the United States
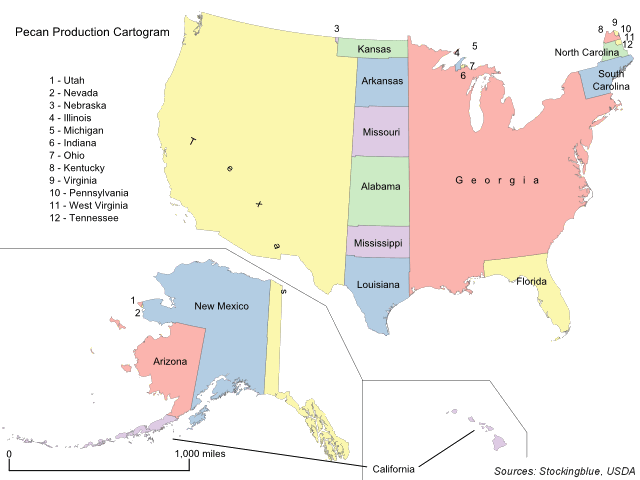
This week, like last year, the focus is on common Thanksgiving foods and which states produce them. The geographically accurate cartogram above redraws the states' sizes based on pecan production. Specifically the number of acres harvested. Only 34 states produce the nut and of the 34, the USDA publishes complete data on only 26 of them due to the other eight states having few producers which would make it easy for their competitors to know how large their operations are.
OlderNewer