Per Capita Gross Domestic Product Cartogram of the Constituent States of the United Kingdom
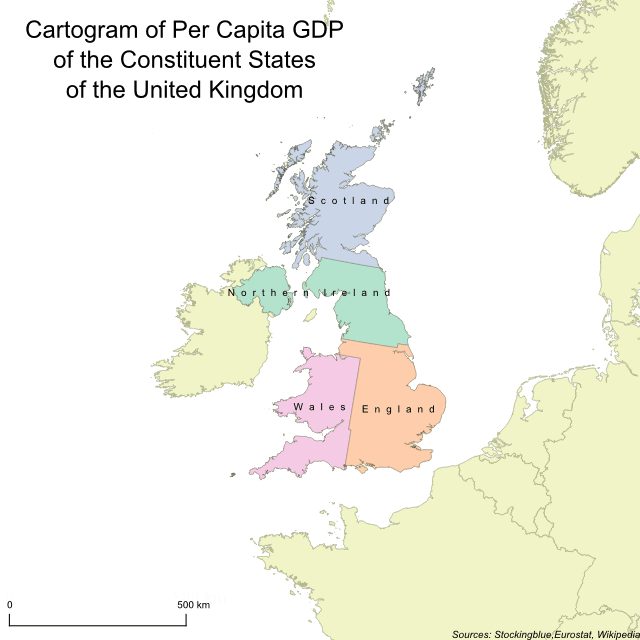
In this geographically accurate cartogram, the constituent states of the United Kingdom are redrawn according to their per capita gross domestic product (GDP). All four states of the United Kingdom are pretty equally sized which shows that the distribution of wealth between the constituent states is pretty even.
EU and US Regions' Vacation Spending As Percent of Per Capita GDP in 2015
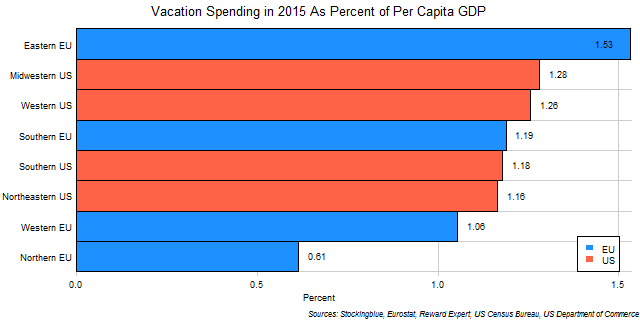
The chart above shows the average vacation expenditures for overnight stays by EU and US region as proportion of per capita GDP. There is a greater discrepancy in vacation spending between regions when per capita GDP is accounted for in the EU than there is in the US.
EU Regions' Vacation Spending As Percent of Per Capita GDP in 2015

The chart above shows the average vacation expenditures for overnight stays by EU region as proportion of per capita GDP. There is quite a disparity on vacation spending in EU regions with the Eastern EU spending more than twice as much of per capita GDP on vacations than the Northern EU.
US Regions' Vacation Spending As Percent of Per Capita GDP in 2015

The chart above shows the average vacation expenditures for overnight stays by US region as proportion of per capita GDP. All four US regions spend just above one percent of their per capita GDP on domestic travel.
EU and US States' Vacation Spending As Percent of Per Capita GDP in 2015
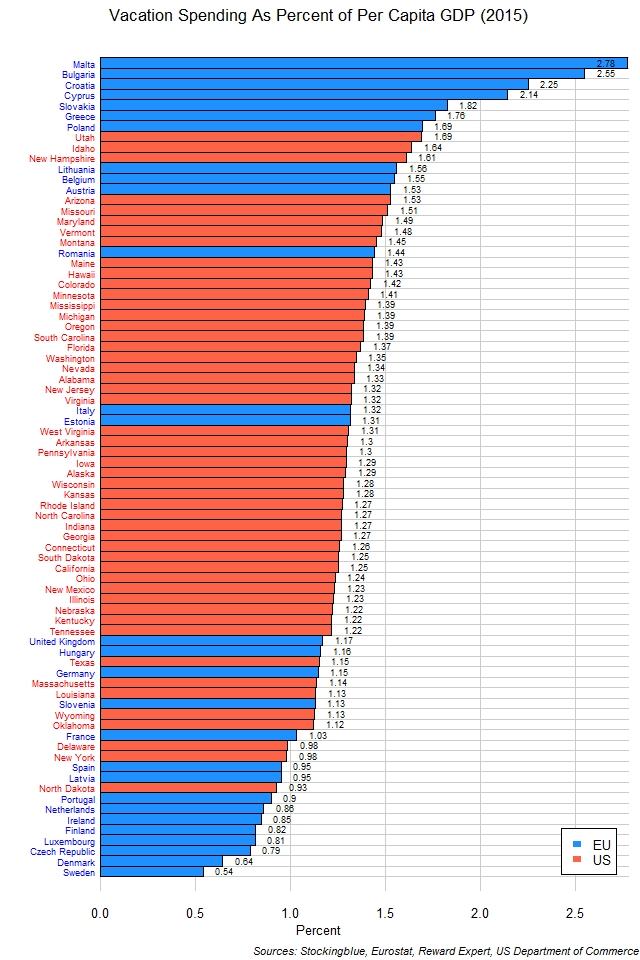
The chart above shows the average vacation expenditures for overnight stays by EU and US state as a proportion of per capita GDP. Americans are more uniform in their vacation spending than Europeans are whose vacation spending ranges from 0.5% of per capita GDP to nearly 3% of per capita GDP.
EU States' Vacation Spending As Percent of Per Capita GDP in 2015
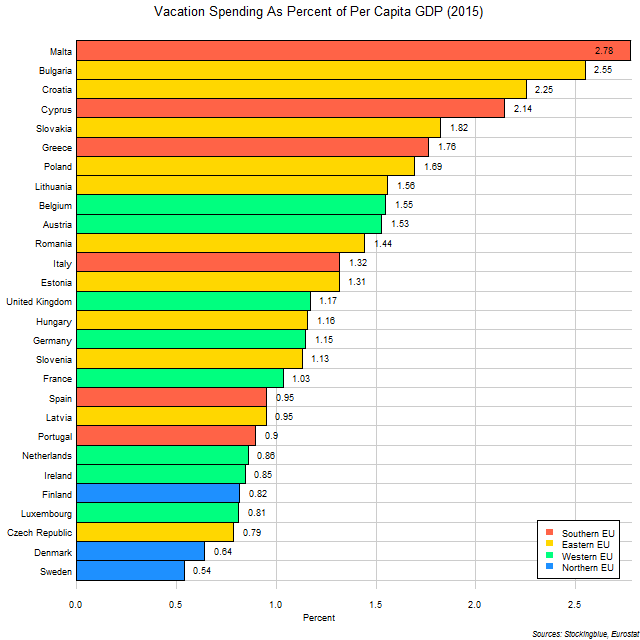
The chart above shows the average vacation expenditures for overnight stays by EU state as a proportion of per capita GDP. Eastern and Southern EU states spend a bigger portion of their personal wealth on vacations as the top eight states in this metric are all from those two regions.
US States' Vacation Spending As Percent of Per Capita GDP in 2015
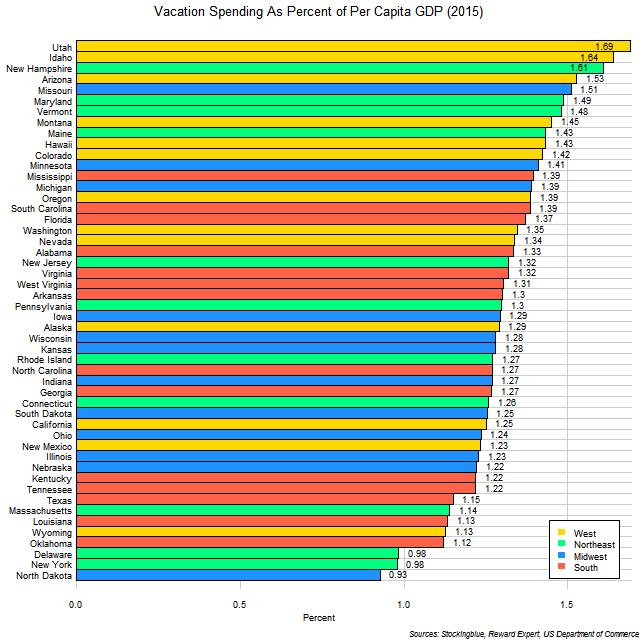
The chart above shows the average vacation expenditures for overnight stays by US state as a proportion of per capita GDP. Almost all states' vacationers spend somewhere around one or two percent of their per capita GDP on domestic vacations.
Per Capita Gross Domestic Product of EU and US Regions
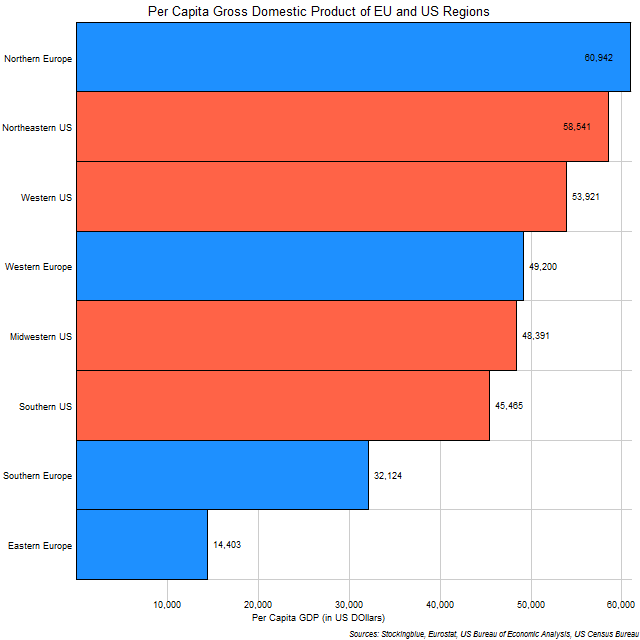
The chart above shows the per capita PPP GDP of EU and US regions. Although Europe has the wealthiest region as measured by the per capita metric, it also has the poorest regions by far.
Per Capita Gross Domestic Product of EU Regions
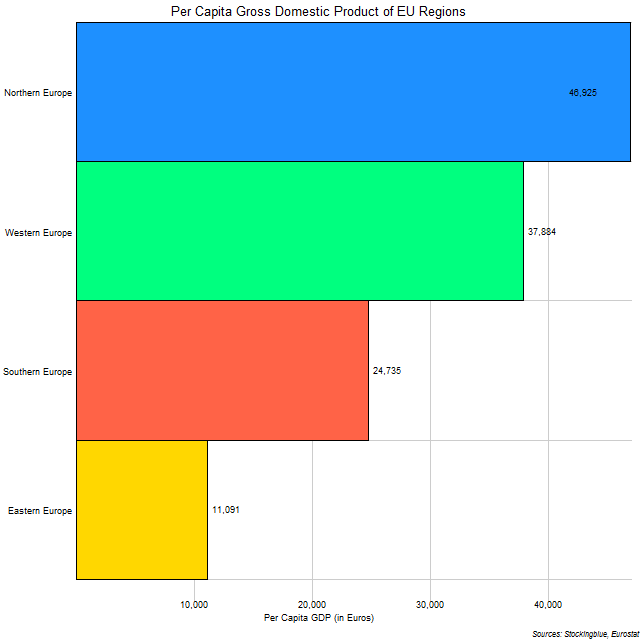
The chart above shows the per capita GDP of EU regions. Although as was shown in a previous report, Northern Europe has the smallest GDP, it does significantly better when GDP is measured on a per capita basis, having the largest of the four main regions.
Per Capita Gross Domestic Product of US Regions
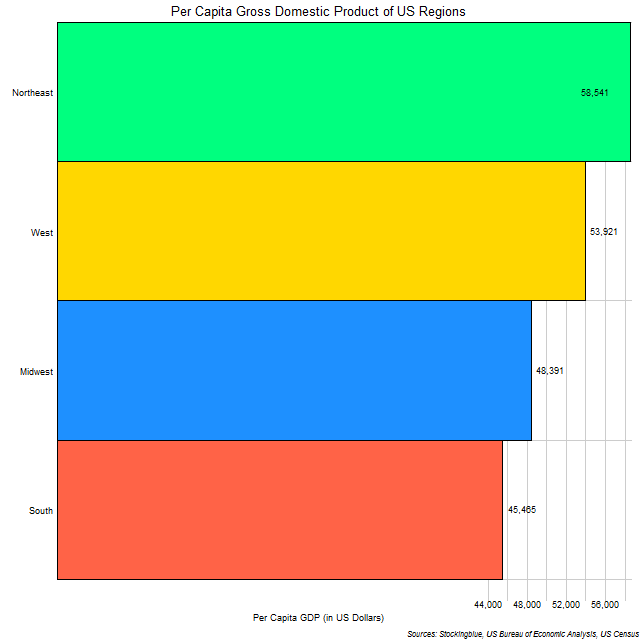
The chart above shows the per capita GDP of US regions. Although as was shown in a previous report, the South has the largest GDP, it doesn't fare so well with per capita GDP, having the smallest of the four main regions.
Older