Unemployment Ratios in the EU and the US, December 2018
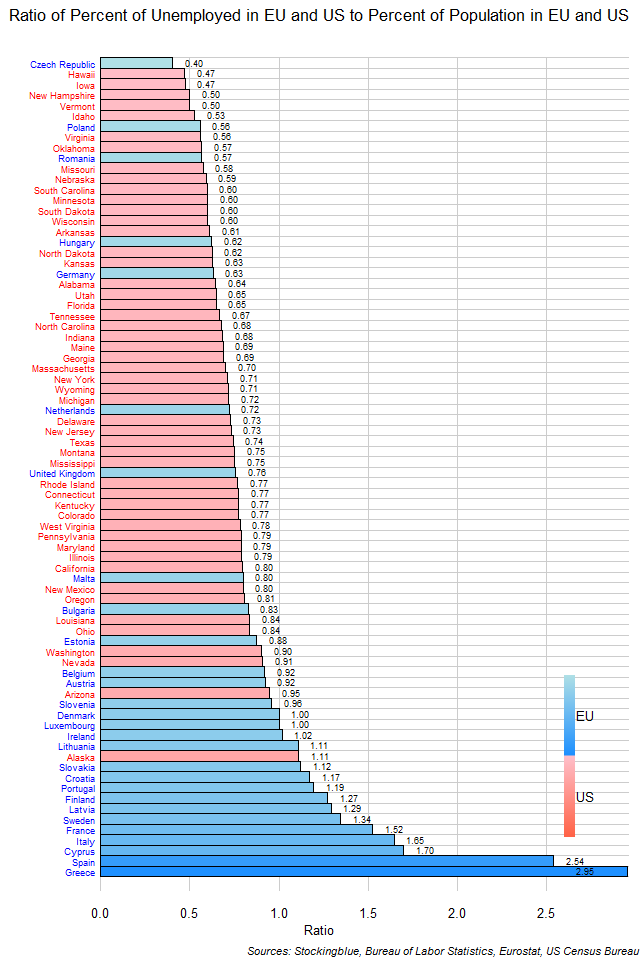
The chart above shows the ratio of the state's proportion of unemployed people in the EU and the US to the state's proportion of total people in the EU and the US. Fourteen states have an unemployed population that makes up a larger proportion of the EU and US total than their total population does. Thirteen of these states are from the EU. The only US state that has a greater proportion of unemployed than total population is Alaska.
Ratio of US States' Unemployed within the US to Total Population within the US, December 2018
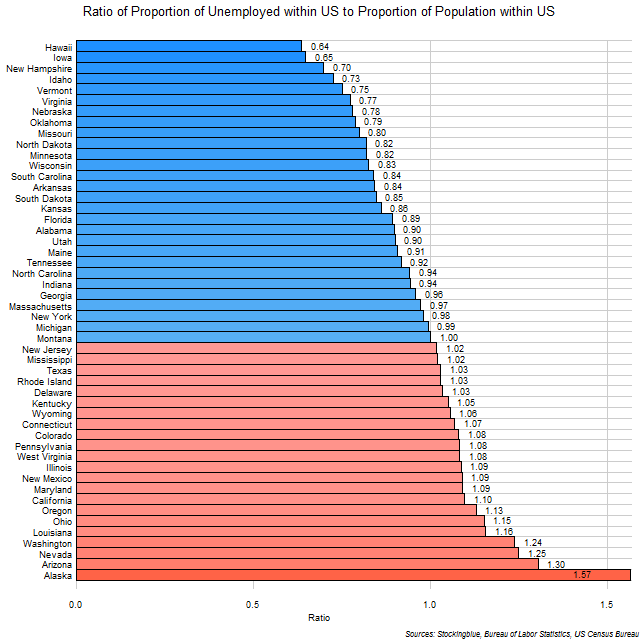
The chart above shows the ratio of the state's proportion of unemployed people in the US to the state's proportion of total people in the US. Twenty-two states have an unemployed population that makes up a larger proportion of the US total than their total population does. For instance, Arizona's unemployed account for 2.70% of the total unemployed people in the US whereas Arizona's population only accounts for 2.07% of the total US population, thus its ratio of unemployed within the US to total people within the US is 1.30.
Ratio of EU States' Unemployed within the EU to Total Population within the EU, December 2018
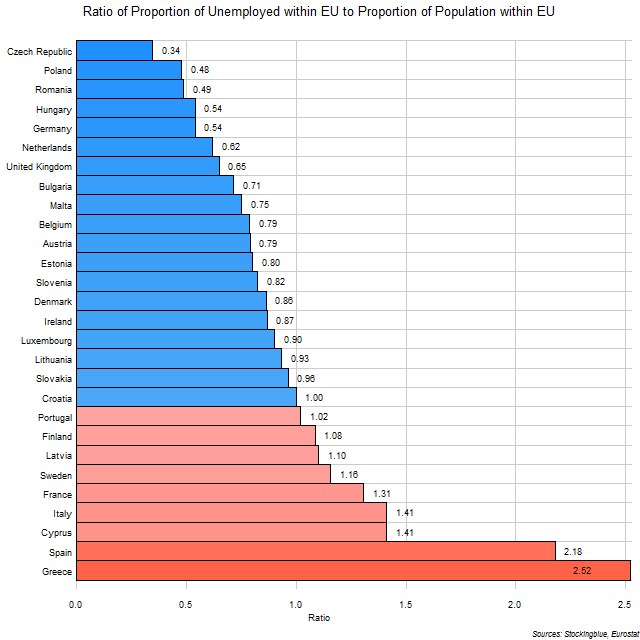
The chart above shows the ratio of the state's proportion of unemployed people in the EU to the state's proportion of total people in the EU. Nine states have an unemployed population that makes up a larger proportion of the EU total than their total population does. For instance, Spain's unemployed account for 20.05% of the total unemployed people in the EU whereas Spain's population only accounts for 9.20% of the total EU population, thus its ratio of unemployed within the EU to total people within the EU is 2.18, or its unemployed population accounts for over twice as much of the EU total than its total population does.
Per Capita Air Travel in EU and US Regions
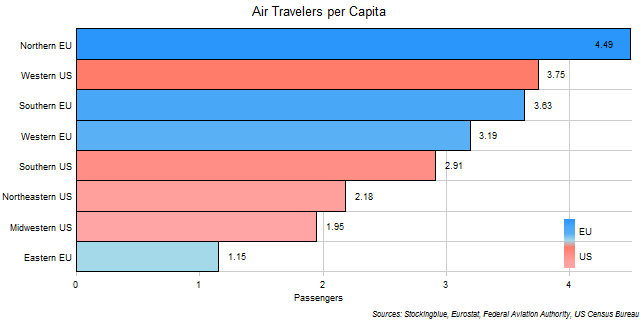
The chart above shows the number of passengers that traveled by air for every resident in each EU and US region. The Northern EU is the only region in both superstates to have more than four air travelers for every resident in the region.
Per Capita Air Travel in US Regions

The chart above shows the number of passengers that traveled by air for every resident in each US region. The West is the region with the most air passengers per capita in the US.
Per Capita Air Travel in EU Regions

The chart above shows the number of passengers that traveled by air for every resident in each EU region. The Northern EU is the region with the most air passengers per capita in the EU.
Air Travel in EU and US Regions
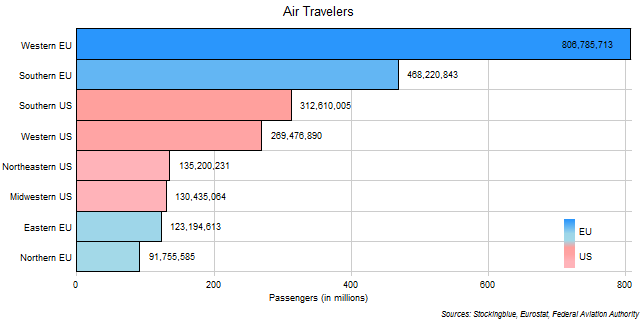
The chart above shows the number of passengers that traveled by air in each EU and US region. The Western EU has so many air travelers that it has more than the next two regions combined.
Air Travel in US Regions

The chart above shows the number of passengers that traveled by air in each US region. The Southern US has the most air travelers just beating out the Western US.
Air Travel in EU Regions

The chart above shows the number of passengers that traveled by air in each EU region. The Western EU has by far the most air passengers and no other region comes close, in fact, it has more air passengers than the three other regions combined.
Per Capita Air Travel in EU and US States
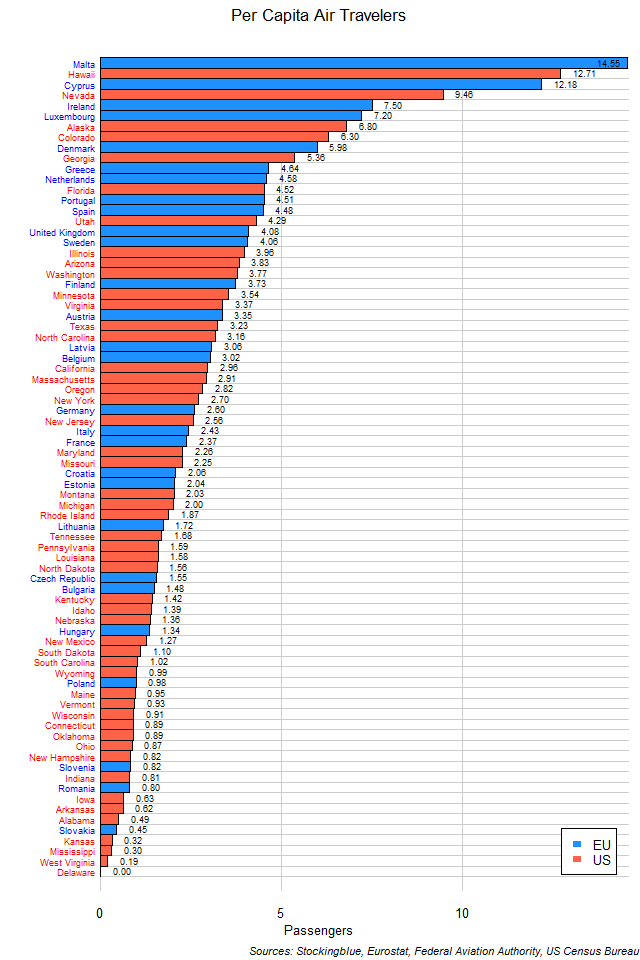
The chart above shows the number of passengers that traveled by air for every resident in each EU and US state. The only three states to have more than ten passengers per resident are all island states.
OlderNewer