Treasury Rate Movements, February 2018
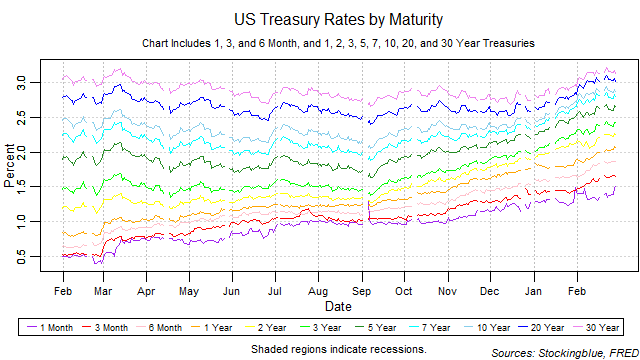
Short, medium, and long-term rates rose from the previous month. The yield curve widened a bit from the previous month and is on a two month widening streak. The one-month bill had maintained the lowest rate throughout the month.
Treasury Rate Movements, January 2018
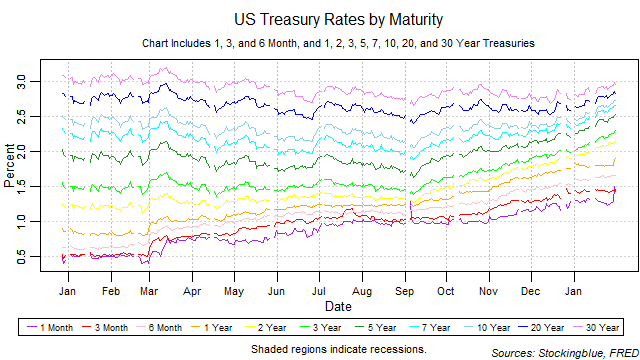
Short, medium, and long-term rates rose from the previous month. The yield curve widened a bit from the previous month reversing direction as it had narrowed in December. The one-month bill had one session where it held a higher rate than the three-month bill.
A Look Back at Treasuries in 2017
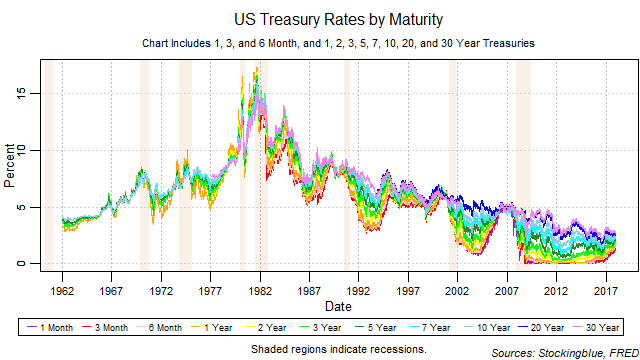
Short-term rates took a dramatic turn upwards after being stuck at zero for several years while long-term rates continued their slow and steady decline. The yield curve continued to narrow but it also narrowed from the bottom up. A narrowing from the short-term is a warning sign for an inversion that indicates recession.
Treasury Rate Movements, December 2017
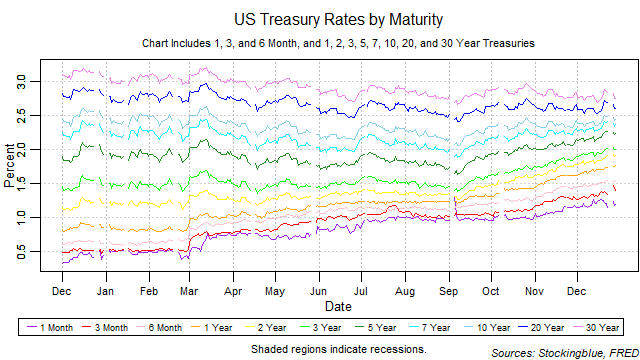
Short-term rates and medium-term rates continued to rise in December while long-term rates dropped from the previous month. The yield curve continued to narrow as it had in the previous month. Short-term rates have increased their rise in rates but the one-month bill had no sessions with higher rates than the three-month bill. That is, the one-month bill maintained the lowest rate throughout the month. However, the yield curve narrowed from both the short and long-term. A narrowing from the short-term is a warning sign for an inversion that indicates recession.
Treasury Rate Movements, November 2017
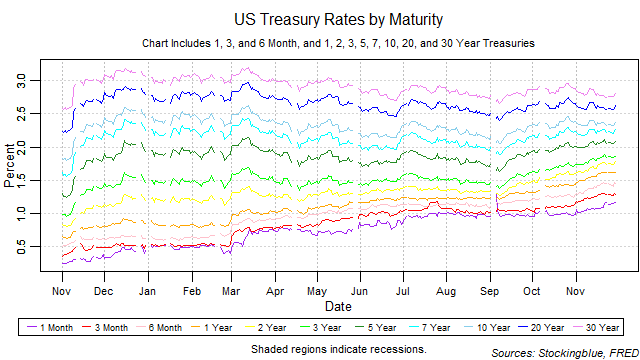
Short-term rates continued their rise in November while medium-term rates rose slower and long-term rates dropped from the previous month. The yield curve continued to narrow as it had in the previous month. Short-term rates have increased their rise in rates but the one-month bill had no sessions with higher rates than the three-month bill. That is, the one-month bill maintained the lowest rate throughout the month. However, the yield curve narrowed from the bottom up and that has been a steadfast indicator of recession.
Treasury Rate Movements, October 2017
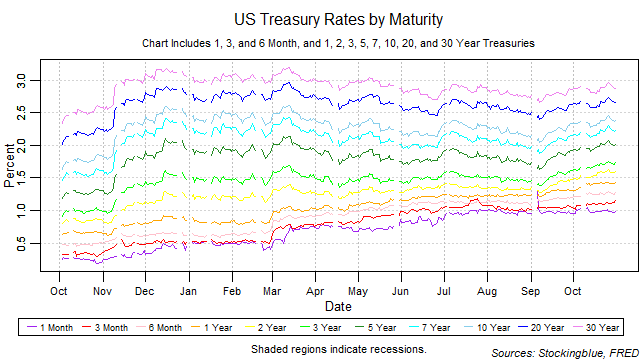
Short-term rates continued their steady rise in October and medium and long-term rates tempered their rise from the previous month. The yield curve narrowed after widening in the previous month. Short-term rates have slowed their rise in rates but October breaks with the previous two months where the one-month bill had a session with higher rates than the three-month bill. That is, the one-month bill maintained the lowest rate throughout the month for the first time in three months. That is a promising sign as a narrowing of the yield curve from the bottom up has been a steadfast indicator of recession. All rates rose in October.
Treasury Rate Movements, September 2017
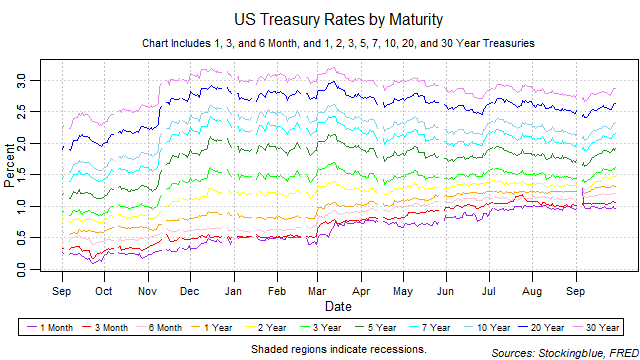
Short-term rates resumed their steady rise in September and medium and long-term rates returned to their relatively more rapid rise. The yield curve widened after narrowing further in the previous month. Short-term rates have slowed their rise in rates but September marks the second month in a row where the one-month bill had a session with higher rates than the three-month bill and an inversion of the yield curve from the bottom up has been a steadfast indicator of recession. No inversion has occurred yet but special attention needs to be paid to short-term rates in the near future. All rates rose in September.
Treasury Rate Movements, August 2017
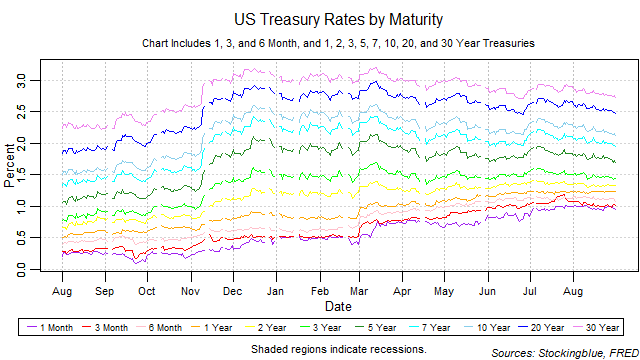
Short-term rates paused their steady rise in August but medium and long-term rates began to fall. The yield curve continues to shrink but it only indicates a recession if it shrinks from the bottom up. The upward tick in the short-term maturities' rates pause is promising as it is a decent indicator that a recession is not on the horizon. All rates fell in August with the exception of the one-year note which rose slightly.
Treasury Rate Movements, July 2017
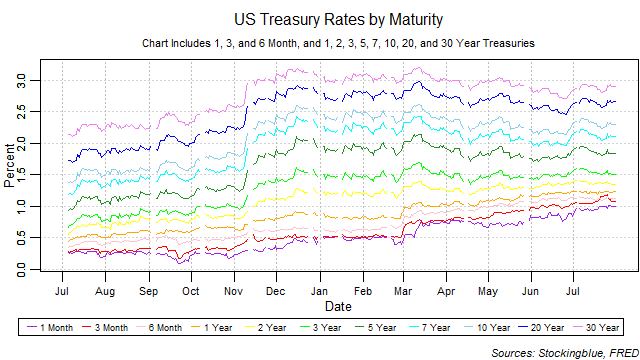
The month of July found short-term maturities' rates continuing their upward trend that started earlier in the year. Long-term maturities' rates have leveled off after dropping slightly earlier in the year. The upward tick in the short-term maturities' rates is troubling as it is a decent indicator of an ensuing recession. Only three out of eleven previous upticks in short-term rates have not led to an inversion of the yield curve.
Treasury Rates and Recessions, a Historic View
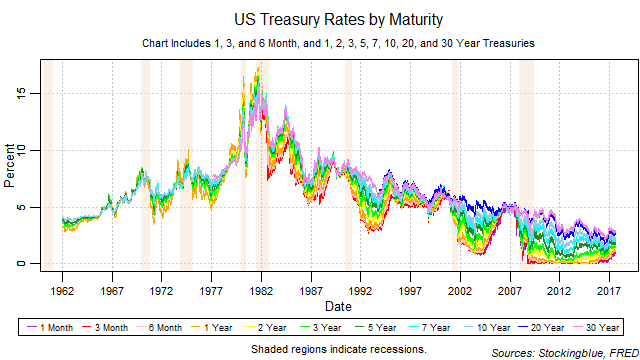
Treasuries have historically been a great indicator for recessions. The traditional view has been that when the yield curve inverts, a recession is soon on its way. This bond report will show trends and fluctuations in the treasury market from a new perspective. Ranges of rates as well as rates by maturity will be charted and analyzed to look for patterns that will help identify changes in the overall economy.
Newer