EU and US Regional Unemployment Rates, January 2021
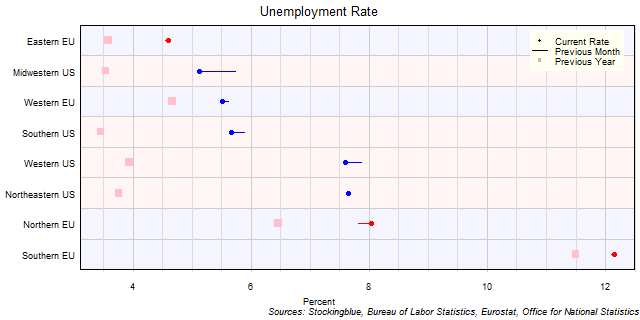
The chart above shows the unemployment rate in each EU and US region as of January 2021 (unless otherwise noted - see caveats below), the change from the previous month, and the rate one year prior. All eight regions have higher rates than they did last year.
EU Regional Unemployment Rates, January 2021

The chart above shows the unemployment rate in each EU region as of January 2021 (unless otherwise noted - see caveats below), the change from the previous month, and the rate one year prior. The Western EU was the only region to see a drop in the unemployment rate over the previous month.
US Regional Unemployment Rates, January 2021

The chart above shows the unemployment rate in each US region as of January 2021, the change from the previous month, and the rate one year prior. All four regions saw a drop in their rate over the previous month.
EU and US Unemployment Rates, January 2021
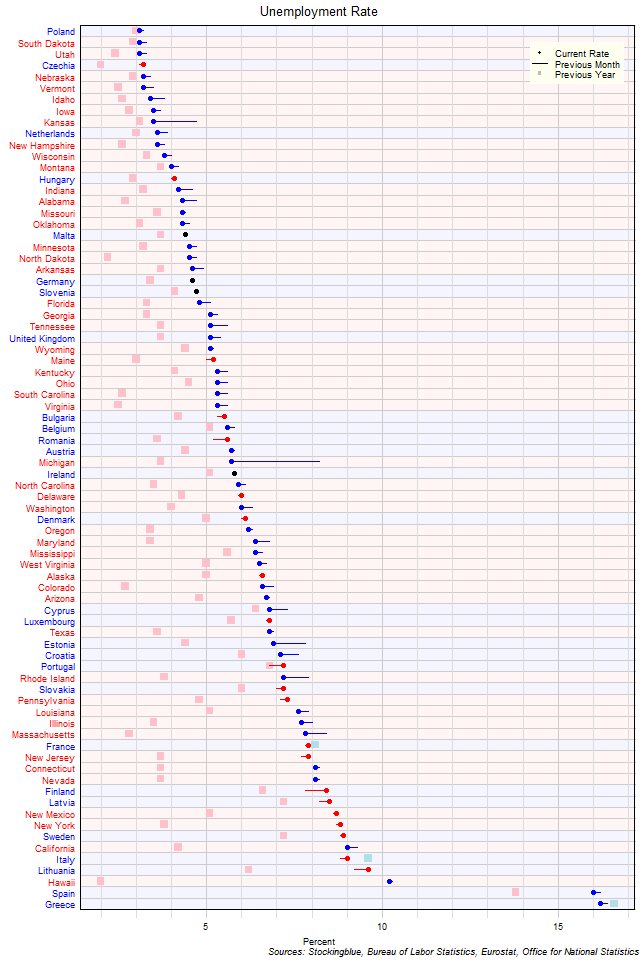
The chart above shows the unemployment rate in each EU and US state as of January 2021 (unless otherwise noted - see caveats below), the change from the previous month, and the rate one year prior. No states have a rate below three percent.
EU Unemployment Rates, January 2021
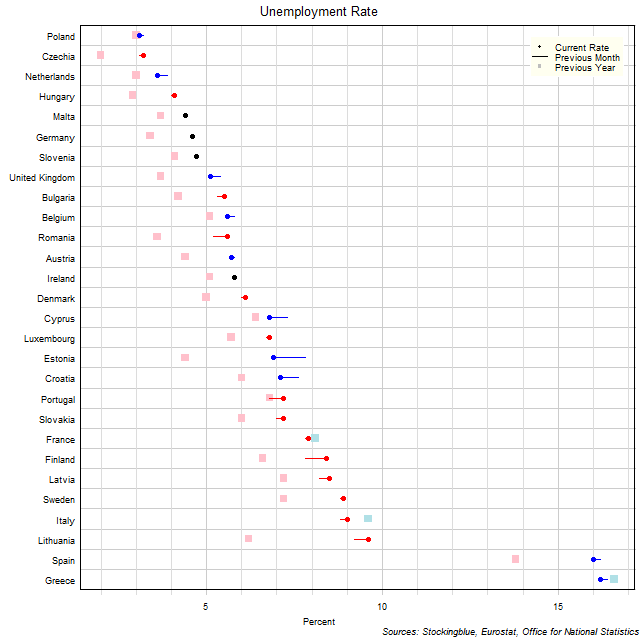
The chart above shows the unemployment rate in each EU state as of January 2021 (unless otherwise noted - see caveats below), the change from the previous month, and the rate one year prior. There are no states with an unemployment rate below three percent.
US Unemployment Rates, January 2021
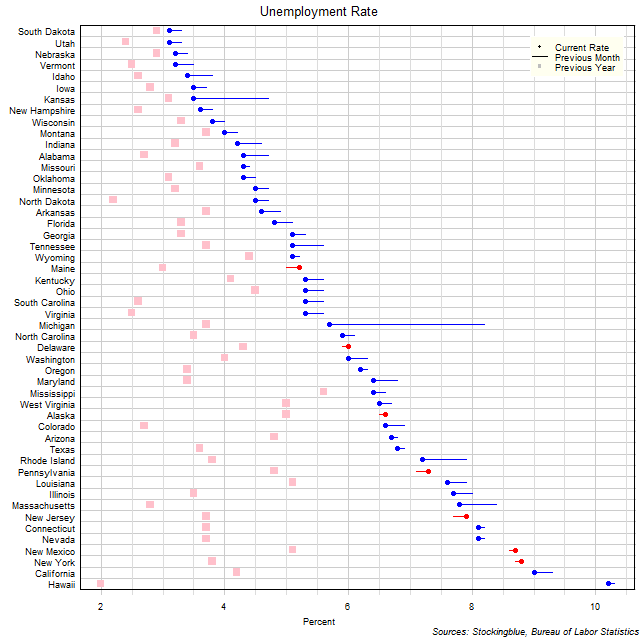
The chart above shows the unemployment rate in each US state as of January 2021, the change from the previous month, and the rate one year prior. The unemployment rate continues to drop in most states resulting in nine states with a rate below four percent.
EU and US Regional Unemployment Rates, December 2020
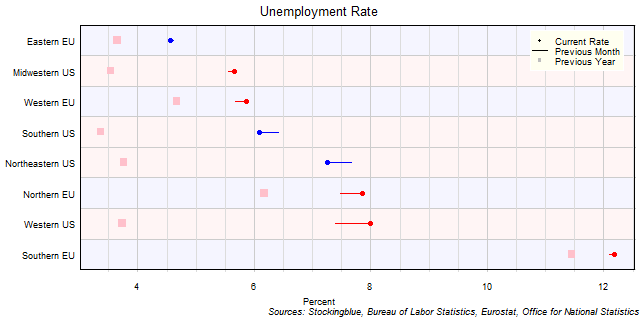
The chart above shows the unemployment rate in each EU and US region as of December 2020 (unless otherwise noted - see caveats below), the change from the previous month, and the rate one year prior. All eight regions have higher rates than they did last year.
EU Regional Unemployment Rates, December 2020

The chart above shows the unemployment rate in each EU region as of December 2020 (unless otherwise noted - see caveats below), the change from the previous month, and the rate one year prior. The Eastern EU was the only region to see a drop in the unemployment rate over the previous month.
US Regional Unemployment Rates, December 2020

The chart above shows the unemployment rate in each US region as of December 2020, the change from the previous month, and the rate one year prior. The Midwest and the West saw a rise in their rate over the previous month.
EU and US Unemployment Rates, December 2020
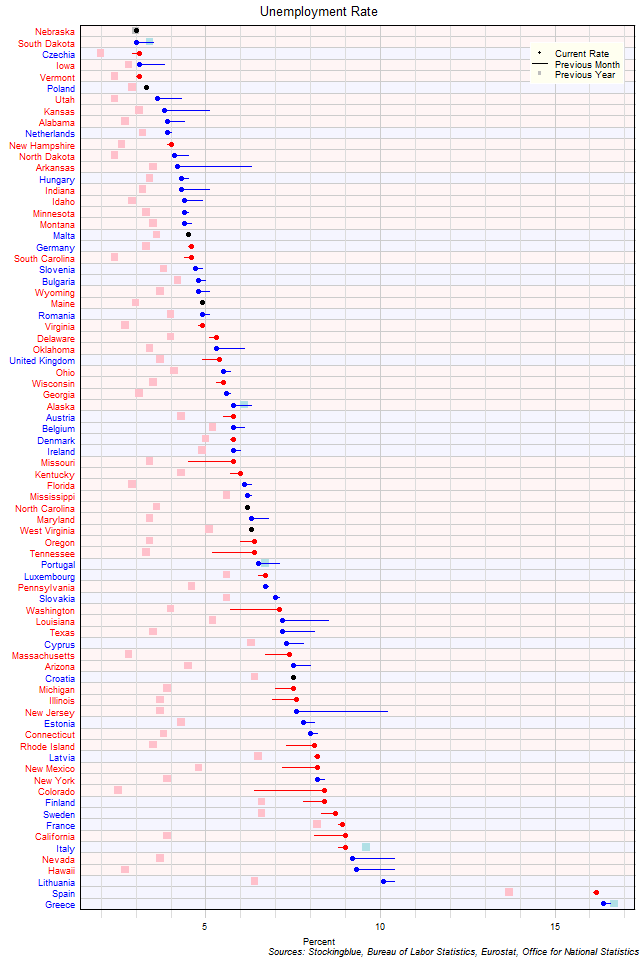
The chart above shows the unemployment rate in each EU and US state as of December 2020 (unless otherwise noted - see caveats below), the change from the previous month, and the rate one year prior. No states have a rate below three percent.
OlderNewer