Net Worth of Billionaires per Square Mile in EU and US States in 2018
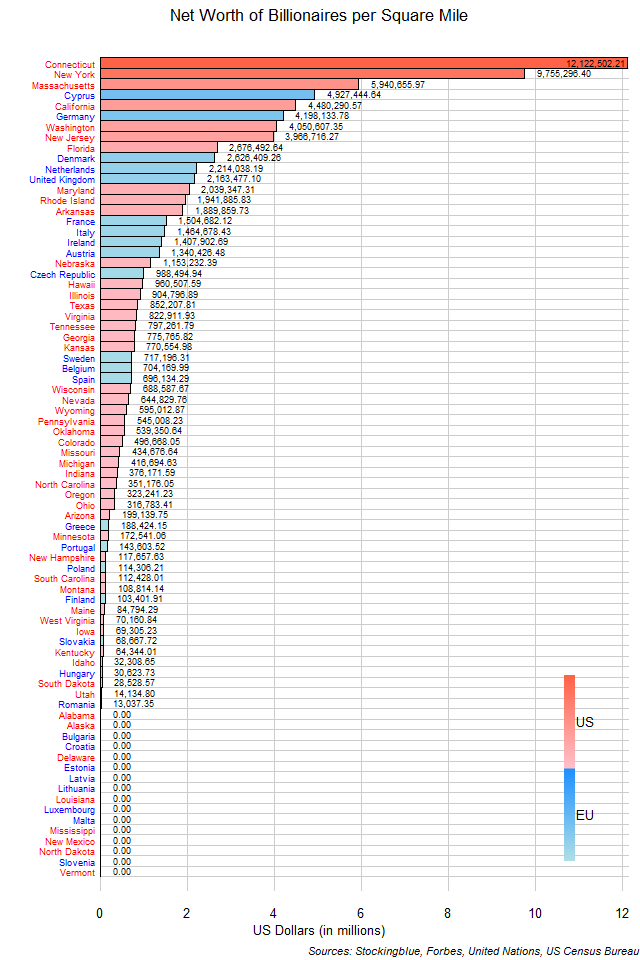
The chart above shows the net worth of the billionaires of each state per square mile. The top three states are all from the US as are four out of the top five and seven out of the top ten.
Average Net Worth of Billionaires in EU and US Regions in 2018
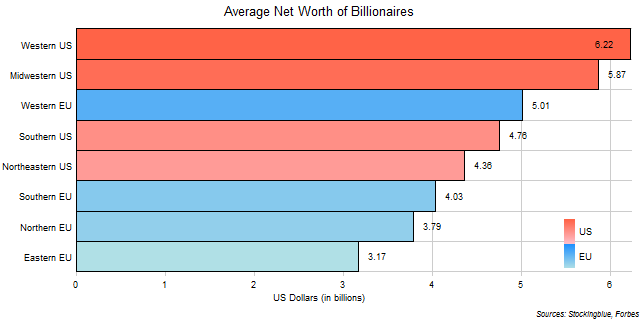
The chart above shows the net worth of the billionaires of each region divided by the population of billionaires in said region. Unlike the previous metric which measured the net worth of billionaires against the total population, this metric shows how wealth is distributed amongst the billionaires of every region. Only the Western US has billionaires who average over $6 billion of net worth.
Average Net Worth of Billionaires in EU and US States in 2018
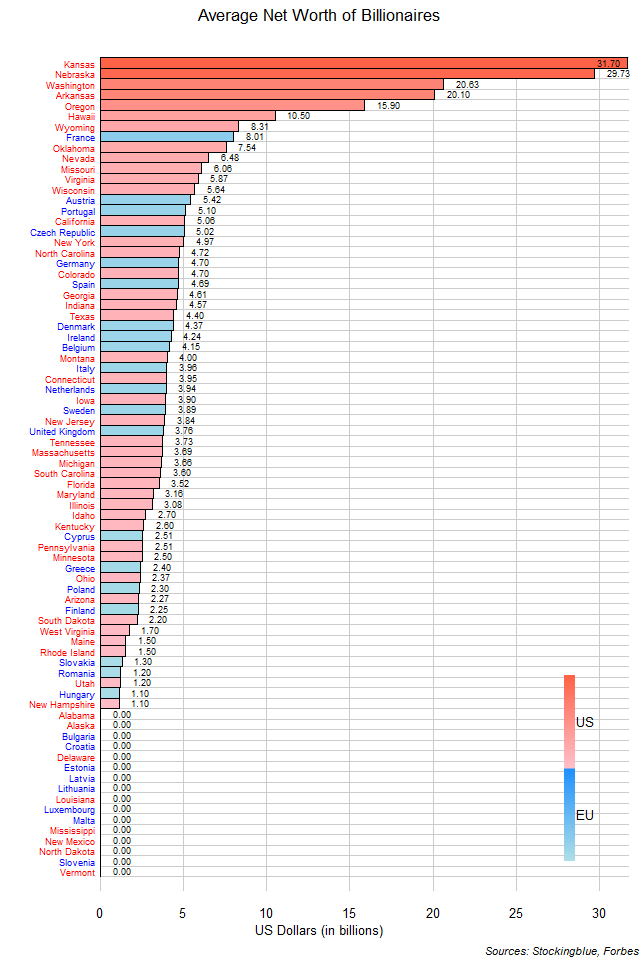
The chart above shows the net worth of the billionaires of each state divided by the population of billionaires in said state. Unlike the previous metric which measured the net worth of billionaires against the total population, this metric shows how wealth is distributed amongst the billionaires of every state. Only US states have billionaires who average over $10 billion of net worth.
Per Capita Net Worth of Billionaires in EU and US Regions in 2018
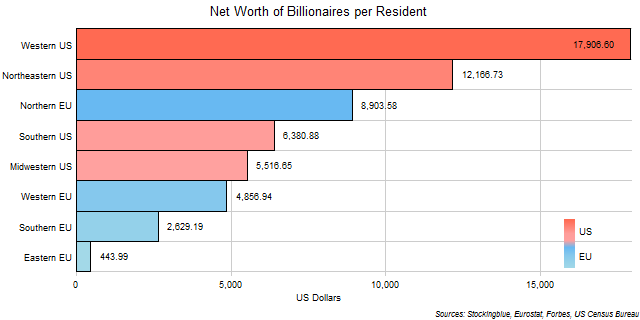
The chart above shows the net worth of the billionaires of each region divided by the population of said region. The Western US dominates over all other regions.
Net Worth of Billionaires for Every Resident in EU and US States in 2018
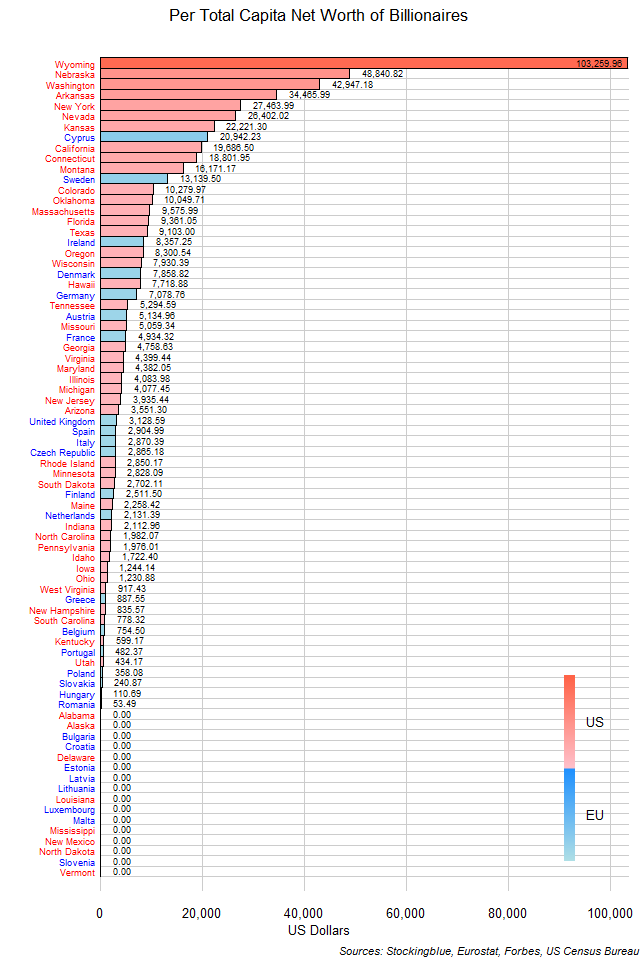
The chart above shows the net worth of the billionaires of each state divided by the population of said state. Wyoming has more than double per capita net worth of billionaires of the next leading state.
Per Capita Air Travel in EU and US Regions
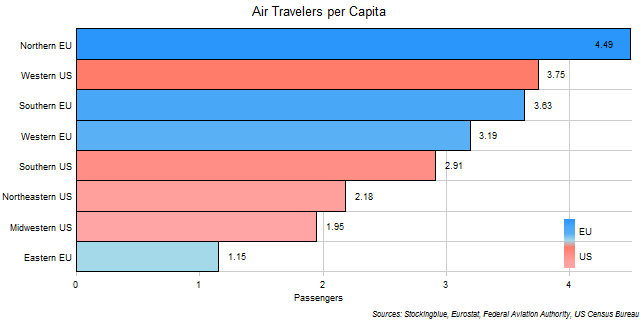
The chart above shows the number of passengers that traveled by air for every resident in each EU and US region. The Northern EU is the only region in both superstates to have more than four air travelers for every resident in the region.
Air Travel in EU and US Regions
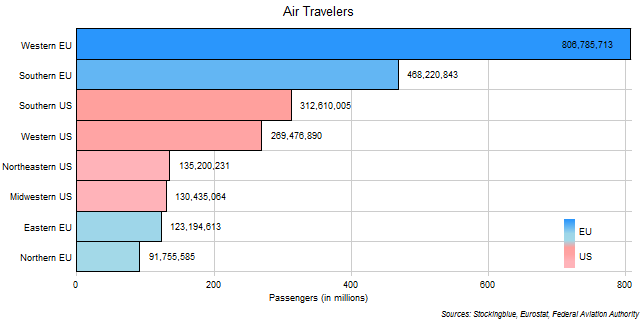
The chart above shows the number of passengers that traveled by air in each EU and US region. The Western EU has so many air travelers that it has more than the next two regions combined.
Per Capita Air Travel in EU and US States
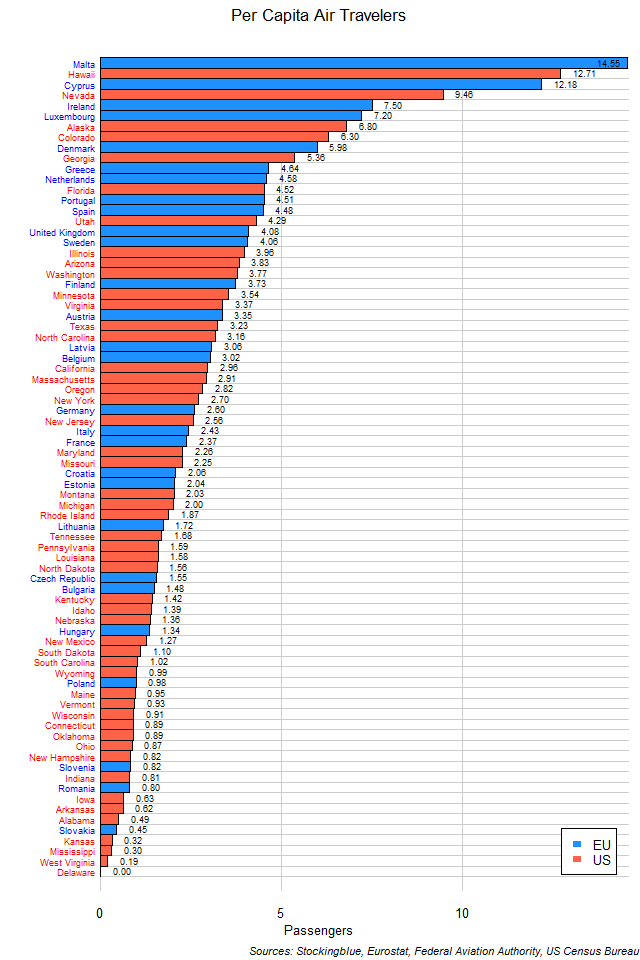
The chart above shows the number of passengers that traveled by air for every resident in each EU and US state. The only three states to have more than ten passengers per resident are all island states.
Air Travel per Capita in US States
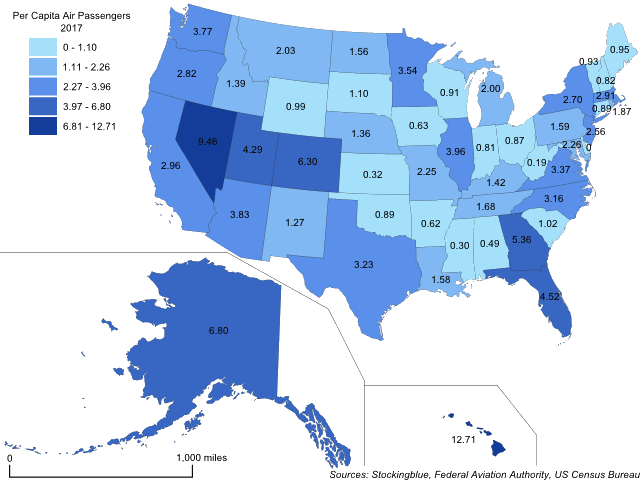
The map above shows the number of passengers that traveled by air for every resident in each US state. Hawaii is the only state to have more than ten air passengers for every resident in the state.
Air Travel in EU and US States
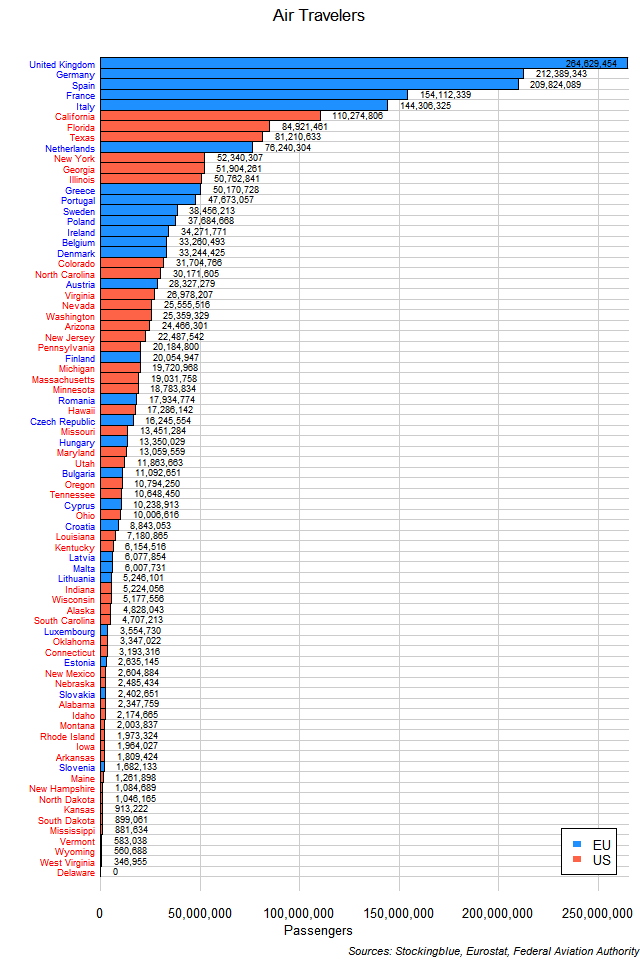
The chart above shows the number of passengers that traveled by air in each EU and US state. The five states with the most air passengers are from the EU. The highest ranked US state, California, ranks sixth overall.
OlderNewer