Transportation Based Carbon Dioxide Emissions in EU and US Regions
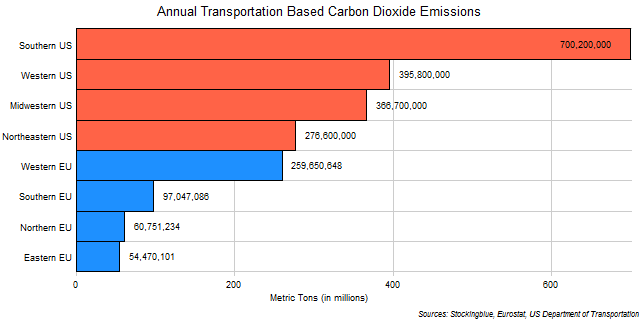
The chart above shows transportation based carbon dioxide emissions in EU and US regions. Clearly, US regions emit far more transportation-based carbon dioxide than EU regions do.
Transportation Based Carbon Dioxide Emissions in EU and US States
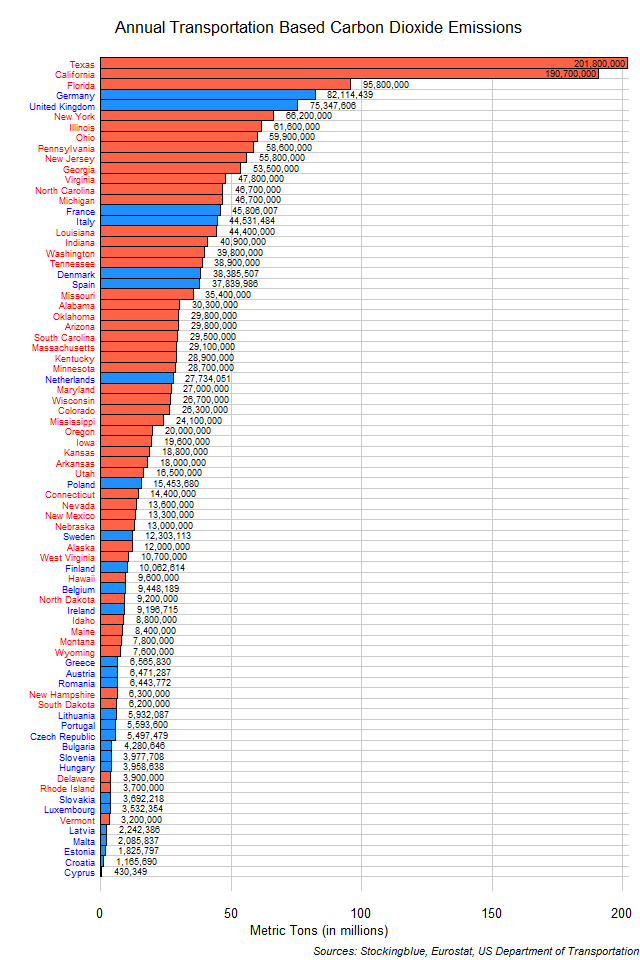
The chart above shows transportation based carbon dioxide emissions in EU and US states. One-quarter of all carbon dioxide emissions from transportation use in the EU and the US come from four states (out of 78): Texas, California, Florida, and Germany. In addition, Texas and California are the only two states that emit more than 100 million metric tons.
Rail Coverage in EU and US Regions
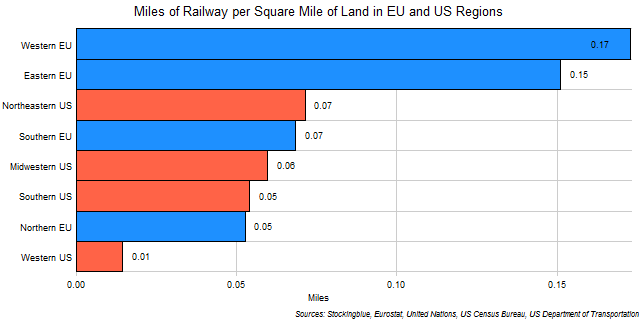
The chart above shows the miles of rail per square mile of land in EU and US regions. The Europeans have more rail per unit of land than we Americans do which is not surprising at all. What is surprising is that the EU's region with the least rail coverage rivals the US's region with the most rail coverage.
Miles of Roadway per Square Mile of Land in EU and US Regions
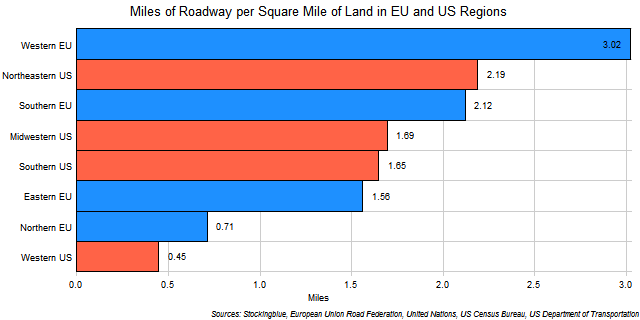
The chart above shows the miles of roads per square mile of land in EU and US regions. Only the Western EU has more than three miles of road for every square mile of territory.
Road to Rail Ratios in EU and US Regions
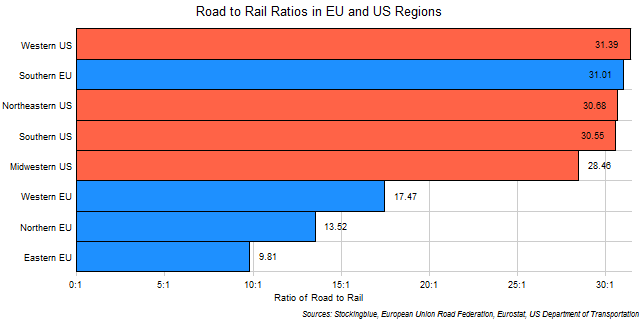
The chart above shows the ratio of the road network to the rail network in every EU and US region. The larger the ratio, the more prevalent roads are over rail in the region. For instance, the Eastern EU has nearly 10 times more kilometers of road for every kilometer of rail. Not surprisingly, all US regions have high road to rail ratios while only one EU region rivals them: the Southern EU.
Vehicles per Thousand Inhabitants in the EU and US
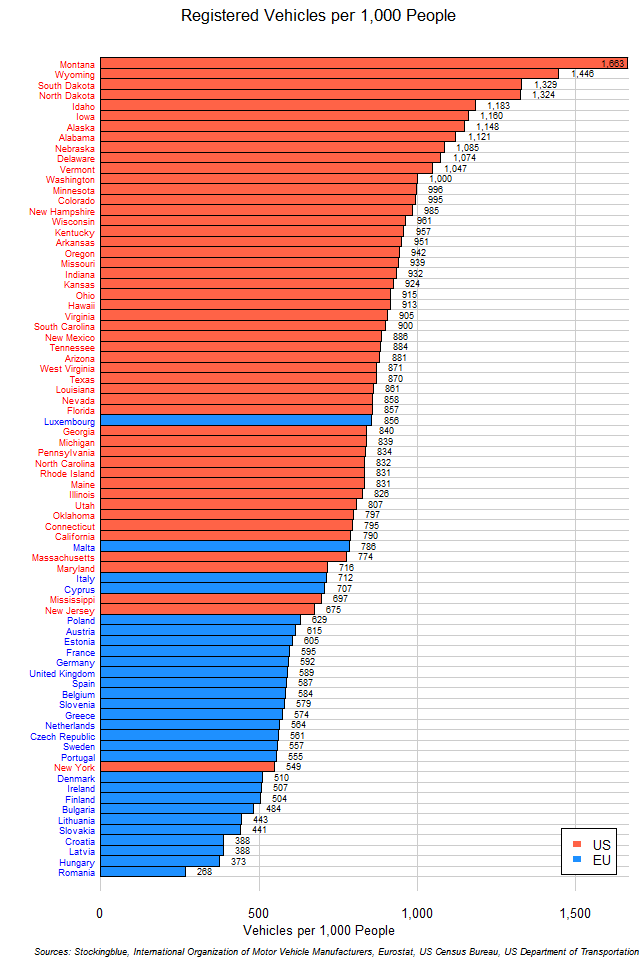
The chart above shows the rate of motor vehicle ownership in EU and US states. Clearly, Americans love motor vehicles more than Europeans do.
EU and US States by Population Density
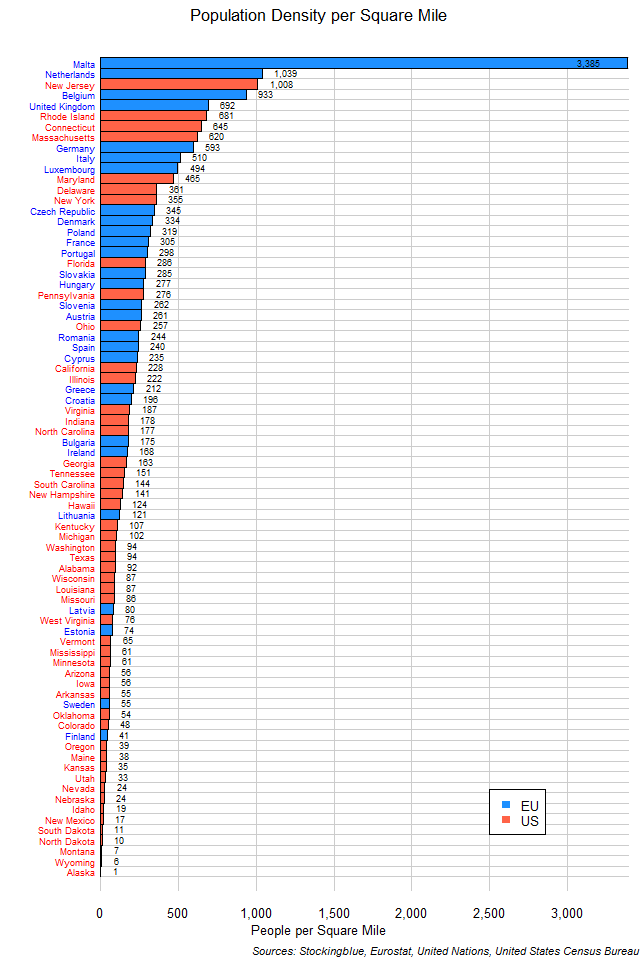
The chart above shows the population density of EU and US states. Not surprisingly, the European Union is much more densely populated than the US is, but what is surprising is how much more densely populated the least densely populated state in the EU is than several US states.
EU and US States Ranked by Gross Domestic Product per Area
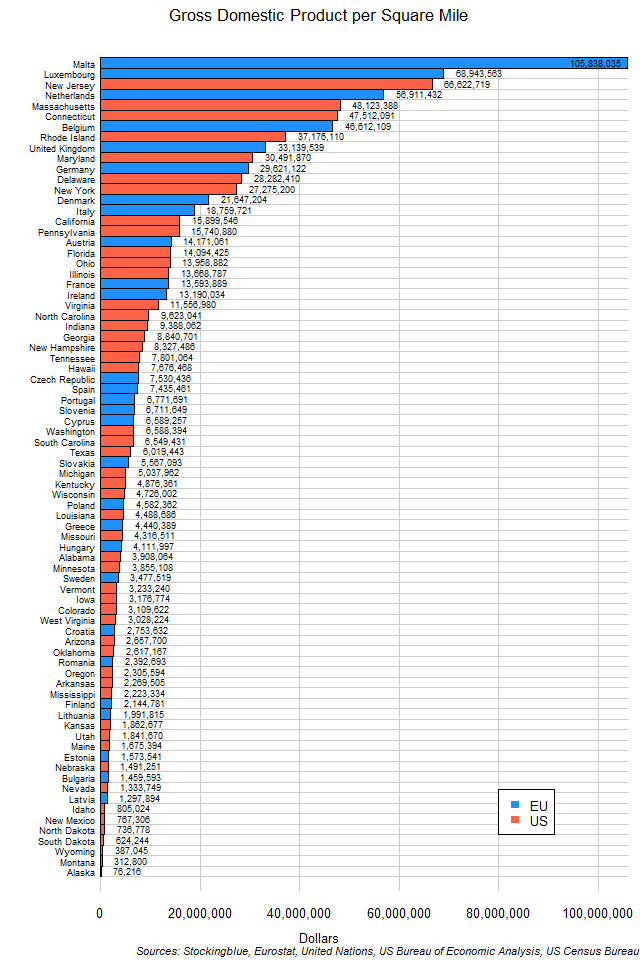
The chart above shows the Purchasing Power Parity Gross Domestic Product (GDP PPP) of EU and US states per square mile of territory in US dollars. EU and US states are distributed pretty much equally in this metric.
EU and US Regions by Area
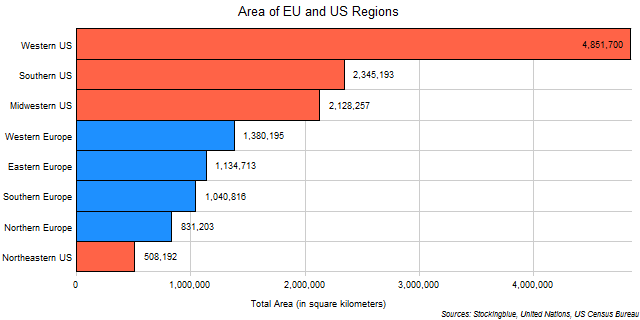
The chart above shows the area of each of the EU and US regions. The Western US is so large that it can fit the entirety of the European Union within it.
Regional Populations of the European Union and the United States
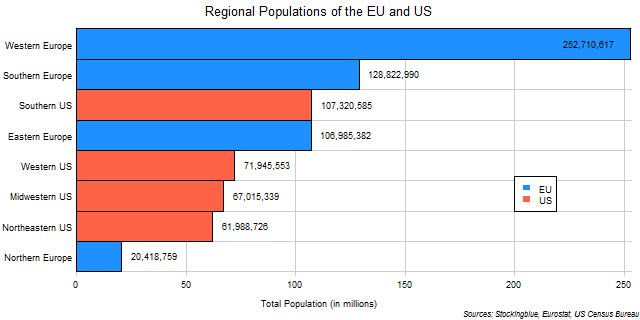
The chart above shows the regional populations of the European Union and the United States. There is a large disparity of population in European regions whereas the population differences are not all that great between American regions.
OlderNewer