Per Capita Gross Domestic Product in EU and US States
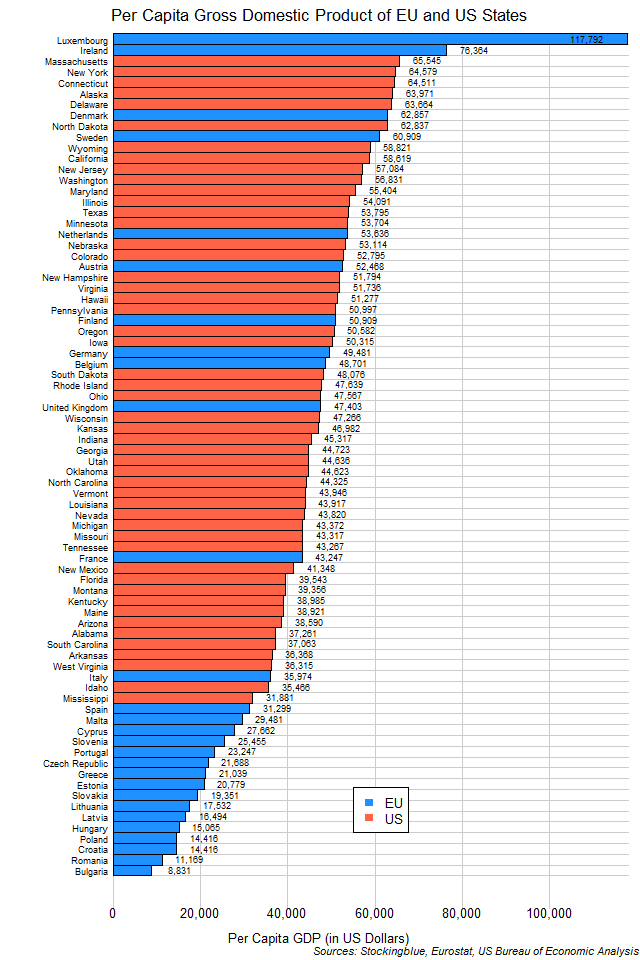
The chart above shows the per capita GDP of EU and US states. Although the EU has the two states with the highest per capita GDP, it also has the 16 states with the lowest per capita GDP.
EU and US Regions by Gross Domestic Product
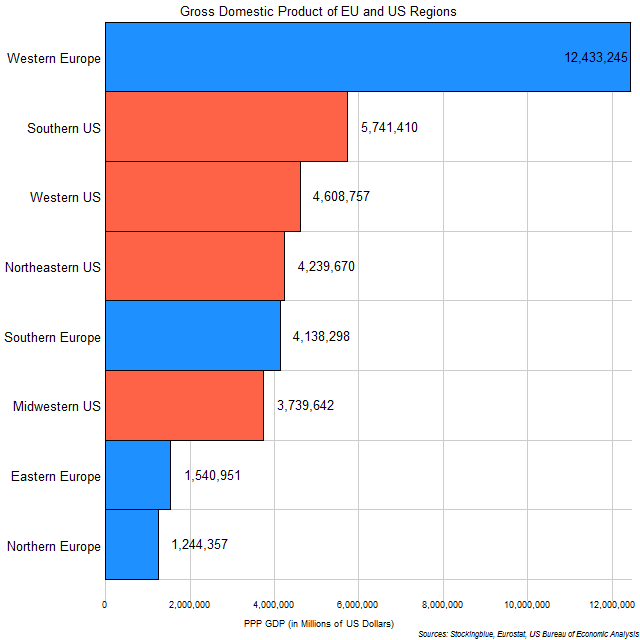
The chart above shows the regional economies of the European Union and the United States. Clearly wealth is distributed far more equally between regions in the US than it is in the EU.
EU and US Cities and States Ranked by Gross Domestic Product
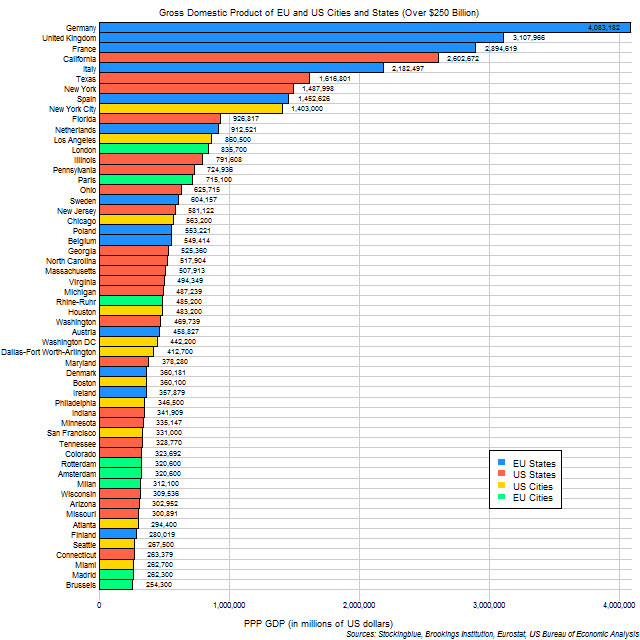
The chart above shows the state and city economies of both the European Union and the United States with GDPs over $250 billion. The EU has the largest state economy but the US has the largest city economy. Below, the remaining states and metropolitan areas that are amongst the 300 largest metropolitan economies in the world with GDPs under $250 billion.
EU and US States Ranked by Gross Domestic Product
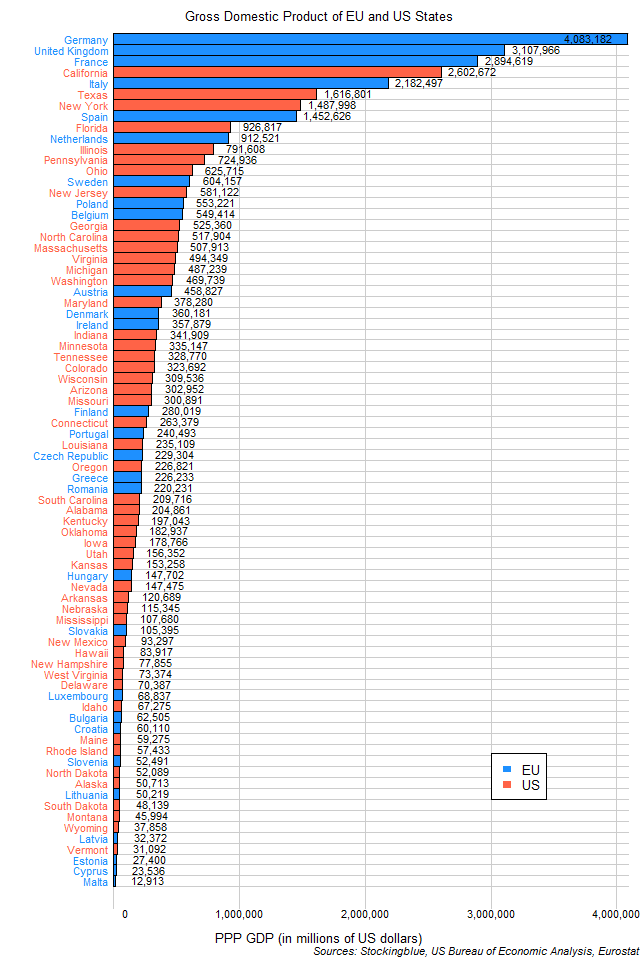
The chart above shows the state economies of the EU and US. The European Union has the three largest economies as well as the three smallest. Quite a feat considering there are nearly half as many EU states as there are in the US.
Cartogram of Think Tanks in the United States
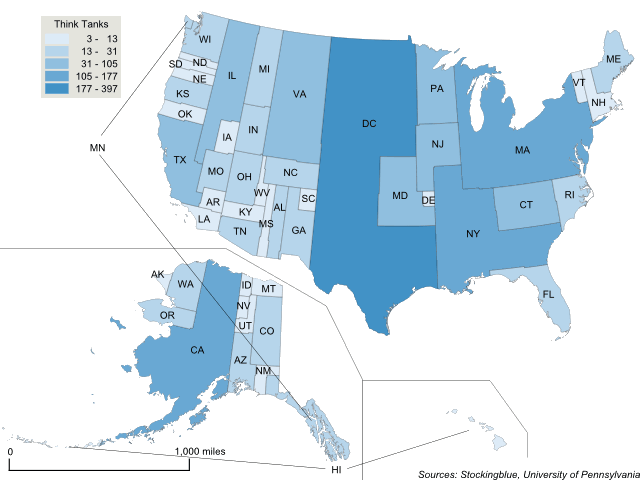
The geographically accurate cartogram above represents the size of the states based on their number of think tanks. Washington DC contains one out of every five think tanks in the US. Think tanks are clearly an east coast phenomenon.
Think Tanks in Europe and the United States
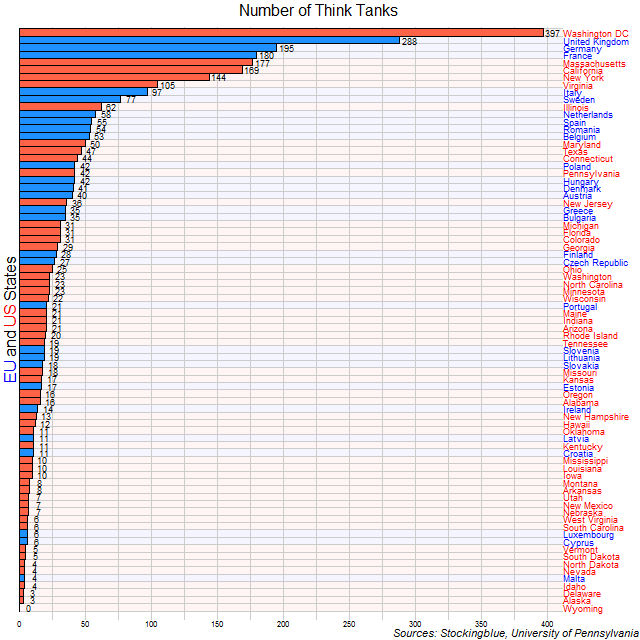
Most states in both the EU and the US do not bother with think tanks so much so, that the entity with the most think tanks by far, is not even a state. Outside of Washington DC, only the United Kingdom has more than 200 think tanks.
Potato Production in the United States
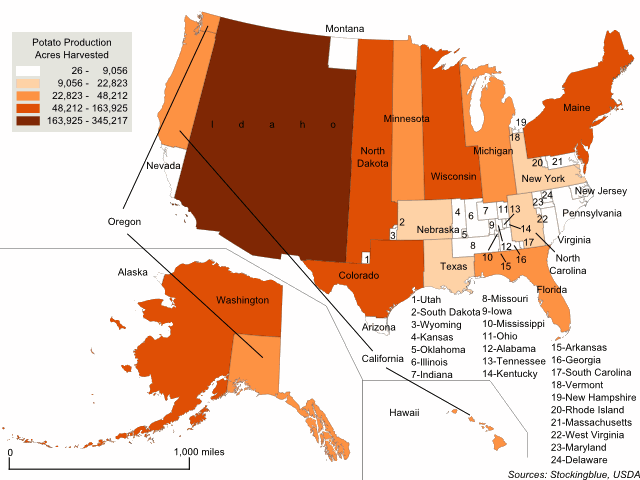
This week, the focus is on common Thanksgiving foods and which states produce them. The geographically accurate cartogram above redraws the states' sizes based on potato production. Specifically the number of acres harvested. All 50 states produce the crop but there is one clear leader in the production of potatoes accounting for nearly one-third of the acres dedicated to the root: Idaho.
Green Bean Production in the United States
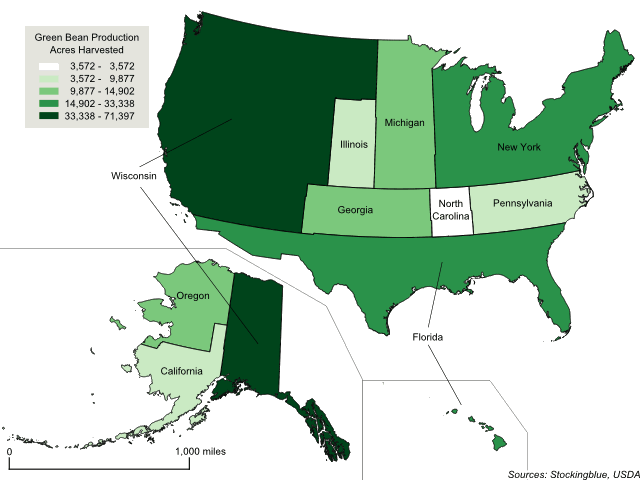
This week, the focus is on common Thanksgiving foods and which states produce them. The geographically accurate cartogram above redraws the states' sizes based on green beans production. Specifically the number of acres harvested. Only 10 states produce the bird and of the 10, the USDA publishes complete data on only six of them due to the other four states having few producers which would make it easy for their competitors to know how large their operations are.
Turkey Production in the United States
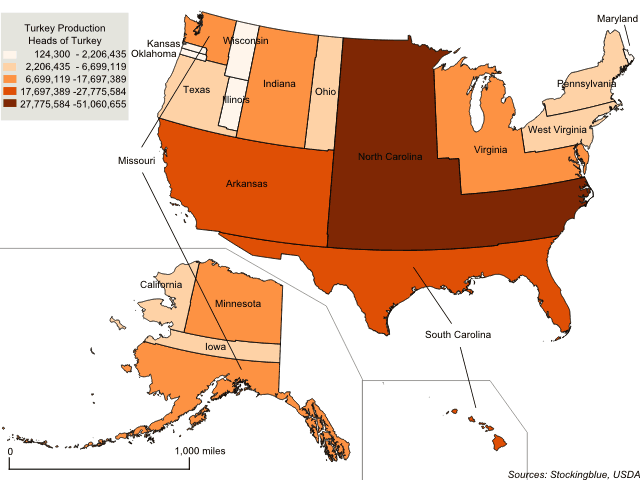
This week, the focus is on common Thanksgiving foods and which states produce them. The geographically accurate cartogram above redraws the states' sizes based on turkey production. Specifically the number of heads of turkey. Only 24 states produce the bird and of the 24, the USDA publishes data on only 18 of them due to the other six states having few producers which would make it easy for their competitors to know how large their operations are.
Pumpkin Production in the United States
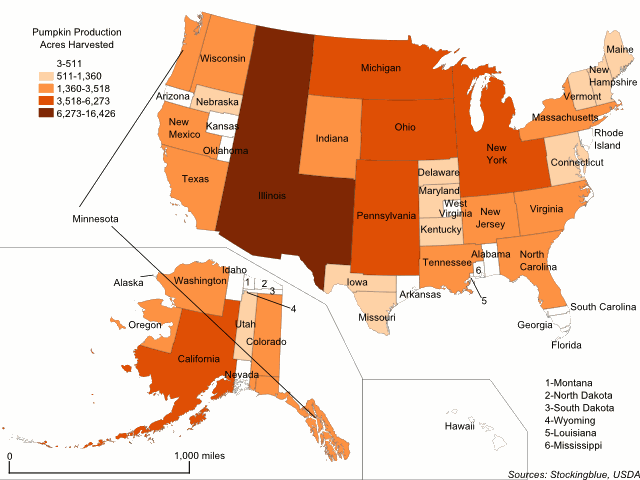
This week, the focus is on common Thanksgiving foods and which states produce them. The geographically accurate cartogram above redraws the states' sizes based on pumpkin production. Specifically the number of acres dedicated to the pumpkin harvest. Every state produces pumpkins, but some dedicate so few acres to the crop that they barely show up on the map, namely Alaska, Wyoming, and Louisiana.
OlderNewer